Wednesday, June 19, 2013

Bankers: Do not Pass GO, Do Not Collect millions and Go Directly to Jail!

By tothetick

A new banking report is published today in the UK.

There are jobs that nobody wants to do really, aren’t there? As your kids are growing up, you hope they don’t ask you one day to come and sit down as they have something serious to talk to you about. Dread! You know what’s coming: “Hey, mom, dad, I’m…I’m going to be a…a banker!”. Then, your whole life falls apart. It’s like being on a par with gutting social-unacceptable jobs like debt-collector and bailiff, isn’t it? The money might be there, but the morals aren’t?

Well, George Osborne, Chancellor of the Exchequer of the UK, has all eyes focused on him with the idea of the century, it seems. A banking commission headed by Conservative MP, Andrew Tyrie has made 80 recommendations to make the banking sector the place you want your kids to work in when they grow up. Morals will change and the banking will be a good job to have!

George Osborne is giving the Mansion-House (residence of the Lord Mayor of London) speech to the city tonight, an annual speech in which the Chancellor of the Exchequer traditionally gives his impression of the state of the British economy. It seems rather unlikely that he will announce some of the recommendations to the bankers that will be seated at the tables in front of him, however. Not unless he wants them to choke on the spicy ingredients that he have been concocted. These include making bankers wait up to ten years to receive bonuses and going to prison. Heard it all before? Thought it? Dreamt of it? The Report did it.
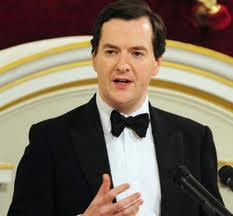
George Osborne, Mansion House Speech

George Osborne, Mansion House Speech

The report is a hefty two-volume reader’s digest of what to do and what not to do in the banking system, entitled “Changing Banking for Good”. Snazzy little tittle that can be read in two different ways as well. Well done Mr. Tyrie. Only a few pages into the report it states that past regulations and supervisory controls had:

  • “little realistic prospect of effective enforcement action, even in many of the most flagrant cases of failure”.

It goes on to state that:

  • “remuneration has incentivised misconduct and excessive risk-taking, reinforcing a culture where poor standards were often considered normal”.

To take out the excessive risk-taking from the lives of bankers in the workplace, the report puts forward the suggestion not only that the bankers should receive the bonuses after a period that could last up to ten years (now that’s time to forget what you have actually done to get the bonus, isn’t it?) but also that the remuneration be in bail-bonds. It also suggests that for wider cases of misconduct remuneration should be cancelled and that if the taxpayer has to foot the bill, then they should definitely not be made. We know from a recent report from the Chartered Institute of Personal Development also that the majority of bankers are in agreement. They think that they are paid excessive amounts and sometimes they don’t know why they get all the money they do. So, if we all agree, let’s cut the bonuses and improve regulation. What are we waiting for?
Bankers: Bonuses

Bankers: Bonuses

The report states that banks have failed the UK in ‘many respects’. £133 billion have had to be injected in bail-outs, amounting to £2, 000 per every person in the UK today. But, it seems that it is also the shareholders that have been let down too. They have had ‘poor long-term returns’.

Excessive risks that were taken in the period leading up to the financial crisis were not down to miscalculation of mathematical equations that boiled down to the bankers getting their sums wrong, but to the fact that the banks were and still are too big to fail. They are able to take greater risks because they are too complex and too enormous. We can’t let them fail and that they know only too well. It’s all very well saying ‘yes, let them fail and then they will see’. But, what will the average person be eating then? Bread and water will be more than just dietary supplements, they will become the staples. Banks today have access to cheaper credit. Their success is determined not so much by the careful and planned placing of financial equity, but the guarantee that lies steadfastly behind them.

The report clearly states that bankers should not flippantly refuse to accept that public anger at high salaries is purely jealousy-driven or petty ignorance. “Rewards have been paid for failure”. Bonuses may have fallen, although the report points out that this has been off-set by fixed-pay rises.

It has also been suggested that there needs to be greater equality in terms of employing women. Women take fewer risks traditionally on the trading floor and so the report asks for employment policy to be changed in banks.

Senior bankers have also come in for a belting from the report, accused of wearing blindfolds as to their responsibility. They are accused of being so far removed from the misconduct that they have ended up being admonished of all responsibility. The report suggests that a prison sentence would certainly make senior officials think about what is being done. The report states that it would “give pause for thought to the senior officers of UK banks”. However, to what extent would senior officials of any bank really consider their potential criminal liability? It also raises the question as to what extent it would be possible to actually see a conviction and criminal liability recognized in a court of law? Hard to prove.

The reports can be found here. Enjoy! If anything actually gets done. Previous suggestions were already ignored by the British government with regard to changes in the banking sector and the report states that it is “disappointed” that this has happened. Aren’t we all?

However, clearly the report states quite a few home truths; things that the average citizen has been feeling and voicing for many a year now. But, until now that has been largely left just as words from angry and jealous members of the public that also want to strike it rich and get paid for doing wrong. Now though, how long will the suggestions that have been made be ignored and how long will the Chancellor of the Exchequer be able to turn a deaf ear to what is being said? The report comes at a timely moment; Mr. Osborne looks like he may still have time to rectify his speech for tonight’s dinner!

The report states “An important lesson of history is that bankers, regulators and politicians alike repeatedly fail to learn the lessons of history”. This time it is (apparently) different. Bankers and everyone else have learned the lessons. Have they?

See the original article >>

Dollar Set to Rise Again

By tothetick

The Federal Reserve will be making an announcement today. The world is waiting with baited breath (at least feigned) to decide whether the bubble busts or it continues to grow in size as Ben Bernanke decides to cut back and taper quantitative easing or continue down the narrowing road that will turn the Federal Reserve into a straight-jacketed asylum seeker. But where will it run to hide? If it continues, it will be slated. If it stops it will get more than just squashed tomatoes thrown in its face. It’ll have to choose today.

In the meantime, the markets have the jitters. The Dollar has even tried to find support and prove that it is indeed not quite ready to have the coffin lowered into the ground just yet. But, that seems like it was only temporary this morning.

Looks like the markets are getting ready for an announcement. The Euro lost some ground in comparison with the dollar awaiting the FOMC statement. At 09.30 GMT, the Euro stood at $1.3391 which was a fall from $1.3396 yesterday. The euro also fell against the Yen from 127.76 Yen late Tuesday to 127.29 today. The dollar fell slightly, however, against the Yen from 95.37 yesterday to 95.05 Yen this morning.

But, is that surprising? The Federal Reserve has managed to somewhat artificially dilute the dollar by injecting more greenbacks into the economy to the tune of $85 billion per month. The prospect of withdrawing that or at least tapering the quantitative easing means that the dollar will be less diluted. That will mean that its value will increase in comparison with other currencies.

Euro vs. Dollar

Euro vs. Dollar

The markets are showing therefore in the main that there will be a tapering of that program that will be announced today. The dollar may well fair well against the euro but we shall see how the markets react and whether stocks increase or fall. My bet will be on the latter. Whatever happens it seems that it will be very difficult given the volatility of the markets over recent weeks to do anything else but see the value of stocks decrease in the wake of that announcement today.

But, according to analysts there are a couple of countries that might come out of all of this with greater benefits. One such currency is the Mexican Peso that has seen its value plummet by 8% against the dollar in a short space of time. The South African Rand has also had to deal with big losses (up to 12% over the same period of time). Emerging markets have suffered from the markets’ fleeing from them into safer havens such as the Swiss Franc and the Japanese Yen. The Franc and the Yen may end up suffering the consequences if the Fed pulls the plugs on quantitative easing.

Analysts believe that the Mexican Peso may benefit from the exit of the Federal Reserve from the stimulus plan because (unlike India or South Africa, for example), they have a strong current-account deficit. Other countries have larger current-account deficits and this may cause problems for them if the Federal Reserve pulls out. Mexico’s economy is strongly linked to that of the USA’s and tends to mirror what’s going on there. If the Federal Reserve pulls out on the stimulus plan, it’ll be because employment is improving and the economy is doing better overall. That means that Mexico will look like it will have the same thing to come and so investors will see it as a good opportunity and go back into the Peso.

Just last week the Peso rose to its highest point ever for the past 21 months. The Euro fell today against the Mexican Peso, down 0.15% (0.0257) to 17.2435 Pesos. The Dollar also fell against the Peso by 0.23% to 12.8664.

Mexican Peso

Mexican Peso

This afternoon (13.00 GMT), however, the Dollar decreased against the Euro. The Euro rallied by 0.07% at 1.3401 Dollars. The Dollar also continued to fall against the Japanese Yen (down 0.31% to 95.0300).

See-sawing back and forth, nothing looks as if it is set in stone. But, one thing is for certain, the Bernanke binge on the greenback hasn’t been doing the market any good at all.

The Federal Reserve meeting will be drawing to a close this afternoon and the financial markets are waiting. Bernanke will be leaving whatever the decision that is taken. But, will the statement that gets made today be clear-cut and as limpid as the financial markets might want. Perhaps, that’s part of the tactic. Peter and the Wolf; not a patch on Ben and the Fed? We’ll end up not believing you, Ben if you carry on telling us it’s coming any minute now! When it gets here, well, just see it fizzle out and go down like a wet firework. Who knows?

See the original article >>

Follow The Bouncing Fed

by Tyler Durden

While all eyes and ears will conveniently and expectedly be on the Fed announcement and press conference in a few hours, the real action continues to take place in China, where the liquidity crunch is becoming unbearable for the local banks (and will only get worse the longer Bernanke and Kuroda keep their hot money policies). The CNY benchmark money-market one-week repo rate was 138bp higher overnight to a 2 year
high of 8.15%. The 7 day Interest-Rate swap rose for a record 13th day in a row jumping +10 bps to 4.08%, the highest since September 2011. China sold 10 Year bonds at a 3.50% yield, above the 3.47% expected, and at a bid to cover of 1.43 which was the lowest since August 2012. Moody’s commented that local government financing
vehicles (LGFVs) pose significant risks to Chinese banks. LGFVs
accounted for 14% of loan portfolios at end-2012 according to Moody’s.

Elsewhere, in Japan central printer Kuroda was speaking in parliament promising that Abenomics will return to normal and talking up the market once more, even as the USDJPY finds itself unable to regain the previous upward momentum despite the rhetoric. Japan reported a jump in May exports, which however was offset by imports, leading to a better than expected trade deficit at JPY 993.9 billion on expectations of JPY1.22 trillion. Still, this was the largest ever May deficit for Japan, and the third biggest ever. Good news then?

Little out of Europe, where several Eurozone and German speakers have poured hot water on the Cyprus request for a bailout modification, saying no change in hell. Even though stocks in Europe have recovered from a lower open, which was also marked by a sharp sell-off in stocks in thin markets, there is a distinct feel of unease, with credit spreads wider as market participants look forward to what is expected to be a crucial FOMC meeting. Wider credit spreads in Europe weighed on financials in Europe. Looking elsewhere, the release of the most recent MPC minutes showed that the MPC voted 6-3 to keep QE unchanged, as expected, with the majority stating that the QE and FLS are still working through economy.

And with all that out of the way: back to your regularly scheduled Fed watching which culminates with a 2pm announcement and a 2:30 pm press conference.

The main bulletin headlines via Bloomberg:

  • Dollar Index trades in a range as markets await clues from FOMC meeting with Bernanke’s press conference the highlight. Most major currencies also sidelined ahead of the U.S. event.
  • Swedish new consumer confidence at 98.2 in June vs 97.7 in May
  • Swedish unemployment rate at 8.2% in May vs est. 8.8%
  • Yen gains for first time in three days versus dollar on bets Bernanke won’t move toward tapering of QE
  • BoE June minutes show King lost his final BoE vote, as majority of committee blocked his bid for more stimulus as they saw economic strength
  • U.K. banker bonuses face decade delays in industry overhaul
  • Bloomberg JPMorgan Asia Dollar Index halts two-day decline before Fed ends two-day meeting today; Thailand’s baht leads gains
  • Korean Won gains on speculation that exporters repatriated income to benefit from currency’s decline to near 2-mo. low

SocGen recaps the layout of the macro and FX considerations on FOMC day:

Market tensions erupted across different asset classes last month and the nature of the Fed's guidance today on the policy of asset purchases will help to decide whether (bond) markets have moved too far in too little time. In truth, the bank's message at the previous FOMC meeting on 1 May was pretty clear: ‘The Committee is prepared to increase or reduce the pace of its purchases to maintain appropriate policy accommodation as the outlook for the labor market or inflation changes'. We see little incentive for the Fed to draw a different set of conclusions on the economy today (eg payrolls came in below 200k last month, probably insufficient to move the policy needle), but some changes to the statement or clarification in the press conference will have to be made to defuse tensions which have propelled 10y cash yields and mortgages 60bp higher since the last meeting. Bernanke made the observation in his JEC testimony to Congress last month that reducing QE purchases would be possible at the next few meetings. Since that testimony on 22 May, the S&P has lost over 1.5% and USD/Asia has gained 1.3%. Laying out the next steps without committing to a timetable to retain flexibility and data dependency is probably the best one can hope for today as the Fed tries to soothe the bond market. Clarifying the mechanics of an exit from stimulus should help volatility to ease off, at least for a while until the timetable for tapering becomes clearer. This may temporarily revive carry/commodity interest (AUD, ZAR) and support a bounce in EM assets more generally, but we see this relief, if it happens, as an occasion to reduce exposure to EM assets.

Reloading topside USD/JPY strikes and selling volatility are two strategies that could work in FX to benefit from today's FOMC statement, whilst a temporary re-adjustment lower in rates and reduced volatility favours a tightening in spreads (receiving USD 1y2y swap forwards, still high vs USTs). In outright terms, 10y swaps still look set on extending above the 2.42% level above which they narrowly managed to close last week. Vols in USD/JPY have started to drift lower since Friday and the 1mth fell to a low of 15.215 yesterday vs a high of 18.90 last week. Unless AUD/USD slips back towards to 0.9400, vol should be a sell too.

The other focus of the day will be the BoE minutes. The 0.98% bounce yesterday in EUR/GBP was order-driven and does not strictly represent a change of sentiment towards the currency pair. Having been locked in the narrowest of ranges for the best part of the last two weeks, only on a close above 0.8606 is it worth considering raising the short-term target to 0.8650. This scenario would get a lift If it transpires that none of the three doves (including outgoing governor King) backed off from voting for an imminent £25bn QE increase despite the spate of stronger macro data of late.

Finally, DB's Jim Reid with the full recap

The reality is that not much has changed data wise since Bernanke's JEC testimony on May 22nd and therefore he has an opportunity to say that the Fed are still data dependant and leaving no set timetable for tapering. However we have to acknowledge that the minutes to the May 1st meeting were on the hawkish side and there are those in the Fed that want to start to pull back from the current levels of stimulus. Our best guess is that the FOMC statement will actually be pretty similar to the last one but that the Q&A will be where all the fun will start. Bernanke has to address asset purchases and every nuance in his replies will be seized upon by markets.

Our gut feel is that the Fed will err on the side of caution with regards to tapering talk and that no additional signal will be given by the Chairman to accelerate the market's fears. However this view is more based on the fact that it’s a personal view that it would be a policy error to withdraw stimulus today. Indeed the last two quarters have seen the lowest US nominal GDP since Q1 in 2010 - some 13 quarters ago now. This is a weakening nominal recovery and one that even at its peak was still very weak relative to history. With a huge debt load nominal GDP is very important but it gets far less attention than it deserves. Nevertheless, the Fed may think very differently to us and their updated economic forecasts will shape their thinking to some degree. They may see the recent dip in inflation as transitory.

In terms of other things to look out for from meeting, DB’s Peter Hooper noted that if they do hint towards imminent tapering then they will stress that fed funds rate hikes are still a long way off and well into 2015 under the FOMC’s projections. Regarding the Fed’s Summary of Economic Projections (SEP) which are scheduled to be released with today’s policy statement, DB’s Joe Lavorgna thinks that the Fed’s forecast ranges for real GDP growth (2.3%-2.8%) and unemployment (7.3%- 7.5%) remain tenable, and thus are not likely to change meaningfully. Changes may occur in inflation forecasts given recent softening inflation indicators. In the last SEP, the year-end core inflation range was 1.5%-1.6% - currently, the core PCE deflator is running at 1.1%. As a result, our US economists would not be surprised to see the lower end of policymakers’ 2013 core inflation range be reduced by 20-30 basis points. We suspect Bernanke’s thoughts regarding the recent market volatility will also be closely watched and keenly interpreted. Finally, there will probably be some questioning around the Chairman’s plans when his tenure ends in January 2014.

On the topic of EM weakness we are seeing little respite from the price action overnight. Indeed, Asian equities are trading lower led by the Hang Seng (-1.2%) and KOSPI (-0.9%). This comes despite the S&P500 (+0.78%) closing near the highs yesterday. Chinese banks are again under some pressure today with banking shares 1-2% lower and CDS/bonds of some major banks 5-10bp wider in Asian trading amidst further reports of tight onshore interbank liquidity. China's CNY one-week repo rate is 138bp higher overnight to a 2 year high of 8.15%. Moody’s commented that local government financing vehicles (LGFVs) pose significant risks to Chinese banks. LGFVs accounted for 14% of loan portfolios at end-2012 according to Moody’s. Although the risk is hardly news for markets, it’s adding to an increasingly cautious view of the sector. Elsewhere in Asia, Japanese equities are trading higher this morning, coming off a weaker yen (-0.1%) and better than expected export numbers (10.1% yoy vs 6.4% expected). The Nikkei is trading 1.3% higher with only utilities stocks in the red, weighed by TEPCO shares (-6.7%) after the company found high levels of radioactive materials in groundwater near its Fukushima power plant (Bloomberg). The Australian dollar continues to lose ground against the USD (-0.1%) at 94.8, after a 0.6% loss yesterday.

Turning to the day ahead, needless to say the attention will be focused squarely on the FOMC. The policy statement and Summary of Economic Projections are due at 7pm London time and the Chairman will be speaking from 7:30pm onwards. Ahead of that, in the UK the BoE publishes minutes from its MPC and Chancellor Osborne’s annual Mansion House speech is expected to outline a plan to sell down stakes in state-owned banks.

See the original article >>

FOMC Scenarios And What's Priced In

by Tyler Durden

While Fed officials are at pains to point out that their two policy tools (asset purchases and rates) the markets continue to link them and the latest increase in Taper chatter has dragged expectations for the first rate hike dramatically forward. Just a month ago, expectations were as late as Jan 2016 but Fed Funds futures have collapsed in recent weeks to imply rate hikes begin in Jan 2015 - a level of 'tightening' not seen since early Summer last year. Bernanke has stated that his communication is aimed at "reducing the risk that market misperceptions of [FOMC] intentions would lead to unnecessary interest rate volatility," but just as with Kuroda, the market seems to not be agreeing and, as we note below, there appears a good, bad, and ugly 'taper' scenario for today.

Rate Hikes being priced increasingly soon...

and Bonds reflecting similar 'tightening' - but obviously stocks don't care.

Which leaves three main scenarios - as we previously noted:

As important as when the Fed might taper its asset purchases is why it might do so. Uncertainty about the Fed’s QE reaction function, BofAML argues, is a significant contributor to recent market volatility. There are several scenarios that could explain why a number of Fed officials have started talking about tapering: they have become more optimistic on the outlook; they are more worried about potential QE costs; they have decided to taper earlier for largely technical reasons. The first of these likely would be the least disruptive for markets, and the last the most. Clear Fed communication could mitigate some of the volatility, but, as BofAML notes, the current lack of consensus on the FOMC likely means uncertainty will likely persist.

Via BofAML,

The good news taper

Several Fed officials have sounded more optimistic on the outlook recently, including noted doves (and current voters) Charles Evans (Chicago) and Eric Rosengren (Boston). Other core Fed officials, such as Chairman Bernanke and New York’s Bill Dudley, sound less convinced in recent remarks and seem to have reluctantly acknowledged that tapering before long is not outside the realm of possibility. If we get a sustainable improvement in the job market data and inflation converging back toward target, that outcome should leave the markets relatively comfortable with the Fed beginning to modestly pull back its accommodation. In that case, markets should be able to transition from Fed-led liquidity support to a better growth-led recovery story.

The bad news taper

The ride could be bumpier if markets conclude the Fed has grown more concerned about QE costs and is ending QE prematurely. We don’t see these concerns motivating the voting majority to taper early: Bernanke and Dudley, for example, admitted to monitoring for financial instability but concluded that the benefits of continued QE outweigh the costs. For some market participants, the current talk of tapering is at odds with the still weak outlook, leading them to conclude that the Fed isn’t acknowledging its true degree of concern over QE costs. Others disagree with the Fed’s current assessment of risks, and expect the Fed will eventually have to tighten policy much sooner than they have indicated. In either case, the process will be more volatile: tapering seen as premature is likely to spur risk-off behavior and increases the odds that the Fed will eventually decide to scale back up their purchases should the data worsen.

The not-so-timely technical taper

A view gaining some traction is that the Fed is discussing tapering because it actually has a lower threshold than indicated, perhaps for some technical reason. There are several variations to this view: the Fed wants to introduce volatility; it wants to “send a message” to the markets; it wants to test a small taper to see the response. Such scenarios would be quite tricky for market participants: they not only fail to clearly identify the Fed’s longer-term reaction function, but also presume the Fed, in part, is hiding its true motives.

The Fed does not typically work this way - not only do these stories run counter to the greater transparency under Bernanke, but they tend to undermine the Fed’s ability to satisfy its dual mandate. Thus our temptation is to fade these stories, but we cannot completely rule out some kind of early, small, technical adjustment to QE. The Fed is limited by a lack of consensus over QE, but they arguably could clarify their reaction function better than they have to date.

The Dove-Hawk Spectrum...

See the original article >>

What Inflation Means to You: Inside the Consumer Price Index

By Doug Short

Note from dshort: The charts in this commentary have been updated to include the June Consumer Price Index news release for the May data.

The Fed justified a previous round of quantitative easing "to promote a stronger pace of economic recovery and to help ensure that inflation, over time, is at levels consistent with its mandate" (full text). In effect, the Fed has been trying to increase inflation, operating at the macro level. But what does an increase in inflation mean at the micro level — specifically to your household?

Let's do some analysis of the Consumer Price Index, the best known measure of inflation. The Bureau of Labor Statistics (BLS) divides all expenditures into eight categories and assigns a relative size to each. The pie chart below illustrates the components of the Consumer Price Index for Urban Consumers, the CPI-U, which I'll refer to hereafter as the CPI.

The slices are listed in the order used by the BLS in their tables, not the relative size. The first three follow the traditional order of urgency: food, shelter, and clothing. Transportation comes before Medical Care, and Recreation precedes the lumped category of Education and Communication. Other Goods and Services refers to a bizarre grab-bag of odd fellows, including tobacco, cosmetics, financial services, and funeral expenses. For a complete breakdown and relative weights of all the subcategories of the eight categories, here is a useful link.

The chart below shows the cumulative percent change in price for each of the eight categories since 2000.

Click to View
Click for a larger image

Not surprisingly, Medical Care has been the fastest growing category. At the opposite end, Apparel has actually been deflating since 2000. Another unique feature of Apparel is the obvious seasonal volatility of the contour.

Transportation is the other category with high volatility — much more dramatic and irregular than the seasonality of Apparel. Transportation includes a wide range of subcategories. The volatility is largely driven by the Motor Fuel subcategory. For a closer look at gasoline, see my weekly gasoline updates.

The Ominous Shadow Category of Energy

The BLS does not lump energy costs into an expenditure category, but it does include energy subcategories in Housing in addition to the fuel subcategory in Transportation. Also, energy costs are indirectly reflected in expenditure changes for goods and services across the CPI.

The BLS does track Energy as a separate aggregate index, which in recent years has been assigned a relative importance of 9.561 out of 100. In other words, Uncle Sam calculates inflation on the assumption that energy in one form or another constitutes about 9.56% of total expenditures, over half of which (5.46%) goes to transportation fuels — mostly gasoline. The next chart overlays the highly volatile Energy aggregate on top of the eight expenditure categories. We can immediately see the impact of energy costs on transportation.

Click to View
Click for a larger image

The next chart will come as no surprise to families footing the bill for college tuition. Here I've separately plotted the College Tuition and Fees subcategory of the Education and Communication expenditure category. Note that the steady staircase in this cost matches the annual cost increases in late summer for each academic year. As we see in this non-seasonally adjusted data, we're on the step following the 2012 riser.

Click to View
Click for a larger image

Core Inflation

Economists and policy makers (e.g., the Federal Reserve) pay close attention to Core Inflation, which is the overall inflation rate excluding Food and Energy. Now this is a somewhat peculiar metric in that one of the exclusions, Energy, is an aggregate that combines specific pieces of two consumption categories: 1) Transportation fuels and 2) Housing fuels, gas, and electricity. The other, Food, is the major part of the Food and Beverage category. I should explain that "beverage" for the BLS means alcoholic beverages. So coffee and Coca Colas are excluded from Core Inflation, but Budweiser and Jack Daniels aren't.

The next chart shows us the annualized rate of change (solid lines) and the cumulative change (dotted lines) in CPI and Core CPI since 2000.

Click to View
Click for a larger image

Consumers, especially those who've managed expenses over several years, are most closely attuned to the top line.

Inflation and Your Household

The universal response is to moan over price increases and take delight when prices are cheaper. But in reality, households vary dramatically in the impact that inflation has upon them. When gasoline prices skyrocket, a two-earner suburban family with long car commutes suffers far more than the metro family with short subway commutes or retirees with no commute. And the pain is even more extreme for low income households whose grocery money shinks with gas prices rise. And remember, Uncle Sam excludes energy costs from Core Inflation.

Households with high medical costs are significantly more vulnerable than comparable households with low expenses in this category.

The BLS weights College Tuition and Fees at 1.734% of the total expenditures. But for households with college-bound children, the relentless growth of tuition and fees can cripple budgets. Often those costs get bundled into loans that saddle degree recipients with exorbitant debt burdens. Consider the following numbers from the CollegeBoard.com website:

  • Public four-year colleges charge, on average, $8,655 per year in tuition and fees for in-state students.
  • Public four-year colleges charge, on average, $21,706 per year in tuition and fees for out-of-state students.
  • Private nonprofit four-year colleges charge, on average, $29,056 per year in tuition and fees.

Of course, Mr. Bernanke would point out that, with a healthy dose of Core Inflation (extended of course to wages), those debt-burdened college grads will pay down the loans with inflated dollars.

Which brings us back to the Fed's efforts to manage the level of Core Inflation. At the macro level, Mr. Bernanke and his Federal Reserve colleagues can doubtless make a theoretical argument for manipulating inflation. But will their efforts — ZIRP and Quantitative Easing — achieve the desired goal? The results thus far haven't been encouraging.

Inflation has been tame in recent months. However, the one thing we can be certain about is this: Increases in inflation will have a painful effect on lower income households, those on fixed incomes, those with higher ratios of transportation costs, college tuition and any household whose discretionary spending is more dream than reality.

See the original article >>

A Long-Term Look at Inflation

By Doug Short

The June 2013 Consumer Price Index for Urban Consumers (CPI-U) released today puts the May year-over-year inflation rate at 1.36%, dramatically below the 3.91% average since the end of the Second World War and over a full percent lower than its 10-year moving average.

For a comparison of headline inflation with core inflation, which is based on the CPI excluding food and energy, see this monthly feature.

For better understanding of how CPI is measured and how it impacts your household, see my Inside Look at CPI components.

For an even closer look at how the components are behaving, see this X-Ray View of the data for the past five months.

The Bureau of Labor Statistics (BLS) has compiled CPI data since 1913, and numbers are conveniently available from the FRED repository (here). My long-term inflation charts reach back to 1872 by adding Warren and Pearson's price index for the earlier years. The spliced series is available at Yale Professor Robert Shiller's website. This look further back into the past dramatically illustrates the extreme oscillation between inflation and deflation during the first 70 years of our timeline. Click here for additional perspectives on inflation and the shrinking value of the dollar.

Click to ViewClick for a larger image

Alternate Inflation Data

The chart below (click here for a larger version) includes an alternate look at inflation *without* the calculation modifications the 1980s and 1990s (Data from www.shadowstats.com).

Click to View
Click for a larger image

On a personal note, the more I study inflation the more convinced I am that the current BLS method of calculating inflation is reasonably sound. As a first-wave Boomer who raised a family during the double-digit inflation years of the 1970s and early 1980s, I see nothing today that is remotely like the inflation we endured at that time. Moreover, government policy, the Federal Funds Rate, interest rates in general and decades of major business decisions have been fundamentally driven by the official BLS inflation data, not the alternate CPI. For this reason I view the alternate inflation data as an interesting but ultimately useless statistical series.

That said, I think that economist John Williams, the founder of Shadow Government Statistics, to which I subscribe, offers provocative analysis on a range of government statistics. While I do not share his hyperinflationary expectations, at least not based on current economic conditions, I find his skeptical view of government data to be filled with thoughtful insights.

For independent evidence that the Consumer Price Index is a reasonably accurate representation of the prices we pay, see the MIT Billion Prices Project US Daily Index.

For a long-term look at the impact of inflation on the purchasing power of the dollar, check out this log-scale snapshot of fourteen-plus decades.

Click to ViewClick for a larger image

See the original article >>

Follow Us