Thursday, June 13, 2013

Debt Is Not America's Real Problem

By Sasha Cekerevac

There continues to be much speculation over when the Federal Reserve will begin to reduce its asset purchase program and lower the level of monetary stimulus. The biggest concern for both the Federal Reserve and the nation is the level of job creation.

Last week, the Bureau of Labor Statistics (BLS) released its monthly report on the level of non-farm job creation, which was as expected: neither too hot nor too cold, with a total of 175,000 new jobs created for the month of May. (Source: Bureau of Labor Statistics, June 7, 2013.)

With the unemployment rate at 7.6%, this level of job creation is still not good enough for the Federal Reserve to begin aggressively reducing its level of monetary stimulus. The truth is that gross domestic product (GDP) growth needs to be stronger for job creation to increase. The underlying fundamentals of the economy are much different than the headlines.

What will surprise many to learn is that one of the biggest drags on the economy is the lack of skilled workers. There are constant reports from companies that they simply can’t find enough skilled workers.

This matches up with the data, as the BLS reports that for those people with a bachelor’s degree or higher—approximately 50 million citizens in the labor force—the participation rate is almost 76%, with the unemployment rate at just 3.8%. Essentially, this part of the economy is at full employment.

Job creation has been extremely strong for those workers with a higher education. If you don’t believe government statistics, simply look at what companies are doing. This year alone, H1B visa applications, which are limited to 65,000 per year, filled up in five days. (Source: “The Visa System Not Working,” The Economist, April 6, 2013.)

Even during the depths of the recession, every year since 2003, the demand for business visas has been higher than the government-restricted ceiling. This means that demand for skilled workers is so high that companies are looking to other nations to try and fill this shortage.

While the Federal Reserve has done what it can to try and improve the economy, job creation ultimately stems from new companies being formed and existing firms expanding. The current restrictions on skilled workers is holding back our nation’s economy, slowing the level of job creation.

Many people have the misconception that America is an untouchable island, but in fact, we are competing with many nations around the world. Just north of us, Canada has embarked on an ambitious program to provide a visa to any foreigner with an investment of CDN$75,000 in starting a new business. This is the type of aggressive program that will lead to job creation and economic growth.

In addition, the Federal Reserve can do nothing about improving the education for many Americans.

Those who have dropped out of high school total just over 11 million in the civilian labor force, and have an unemployment rate of 11.1%, with a participation rate of just 45%. High school graduates with no college education total 36 million, with a participation rate of 58.9%, and an unemployment rate of 7.4%.

It is clear that the economy could operate at a much higher level if we had more people with higher skills and education. The Federal Reserve cannot run the education system, which is an extremely weak link that is leading to the current lack of job creation.

In addition, we should open the doors to anyone who wants to start businesses in America. If we don’t open those doors, other nations will. Not only are countries like Canada offering attractive incentives to start businesses, which ultimately results in job creation, but their taxes are far lower as well, with corporate taxes at just 15%.

We have major structural issues to fix, and the responsibility to fix these issues rests not on the Federal Reserve but on the politicians in Washington.

See the original article >>

Cotton moves higher in reaction to USDA estimates

By Jack Scoville

COTTON

General Comments: Futures were higher in reaction to the USDA supply and demand estimates that showed more demand and less ending stocks. It also cut production estimates due to poor weather in the South. USDA anticipates more demand from China. World estimates continued to show big supplies,, but a big part of that is located in China and will not be generally available.. Traders also talk of reduced production potential due to the poor weather seen until recently in the Delta and Southeast and still reported in parts of Texas. Trends are up. Ideas of good weather for US crops are still around. Traders are worried about Chinese demand, but there is talk that overall demand increased in the last week. The weather has improved, but it is still too dry in Texas and drier weather is needed for the Delta and Southeast. Dry conditions are forecast for the Delta and Southeast, and dry and warm weather is expected in Texas. Weather for Cotton appears good in India, Pakistan, and China.

Overnight News: The Delta and Southeast will see dry conditions. Temperatures will average above normal. Texas will get dry weather. Temperatures will average above to much above normal. The USDA spot price is now 85.86 ct/lb. ICE said that certified Cotton stocks are now 0.536 million bales, from 0.533 million yesterday. USDA said that net Upland Cotton export sales were 101,100 bales this year and 97,300 bales next year. Net Pima sales were 1,800 bales this year and 1,700 bales next year.

Chart Trends: Trends in Cotton are up with objectives of 9140 and 9550 July. Support is at 88.40, 87.60, and 81.70 July, with resistance of 90.50, 91.15, and 91.60 July.

FCOJ

General Comments: Futures closed lower even though USDA showed another reduction in Oranges production in Florida. It seemed to be a buy the rumor and sell the fact situation as decreased production had been expected.. Traders are wrestling with more reports of losses from greening disease on the one side and beneficial rains that have hit the state on the other. Greening disease and what it might mean to production prospects continues to be a primary support item and will be for several years. Temperatures are warm in the state. The Valencia harvest is continuing. Brazil is seeing near to above normal temperatures and dry weather.

Overnight News: Florida weather forecasts call for light showers. Temperatures will average near to above normal.

Chart Trends: Trends in FCOJ are mixed. Support is at 148.00, 145.00, and 144.00 July, with resistance at 154.00, 156.00, and 159.00 July.

COFFEE

General Comments: Futures were lower in New York on speculative selling tied to reports of bigger production in Colombia and Brazil, and weakness continued in London due to ideas of big supplies from producers, mostly from Vietnam. Arabica cash markets remain quiet right now and roasters in the US are showing little interest in buying. There is talk of increasing offers of Robusta from producers as they apparently did not sell when prices were much higher. Most sellers, including Brazil, are quiet and are waiting for futures to move higher. Buyers are interested on cheap differentials. Brazil weather is forecast to show dry conditions, but no cold weather. Current crop development is still good this year in Brazil. Central America crops are seeing good rains now. Colombia is reported to have good conditions.

Overnight News: Certified stocks are unchanged today and are about 2.746 million bags. The ICO composite price is now 117.17 ct/lb. Brazil should get dry weather except for some showers in the southwest on Sunday. Temperatures will average near to above normal. Colombia should get scattered showers, and Central America and Mexico should get showers. Temperatures should average near to above normal.

Chart Trends: Trends in New York are down with objectives of 116.00 July. Support is at 119.00, 116.00, and 113.00 July, and resistance is at 125.00, 127.00, and 130.00 July. Trends in London are down with objectives of 1765 July. Support is at 1770, 1740, and 1710 July, and resistance is at 1810, 1845, and 1865 July. Trends in Sao Paulo are down with no objectives. Support is at 147.00, 144.00, and 140.00 September, and resistance is at 155.00, 159.00, and 161.50 September.

SUGAR 

General Comments: Futures closed lower due to ideas of big world supplies. There was no other real news for the market besides the USDA data. The price action overall remains weak and implies that further losses are coming down the road due to coming Brazil supplies. Traders remain bearish on ideas of big supplies, especially from Brazil. Traders in Brazil expect big production as the weather is good. Demand is said to be strong from North Africa and the Middle East, but starting to fade now as needs are getting covered.

Overnight News: Showers are expected in Brazil. Temperatures should average near to above normal.

Chart Trends: Trends in New York are mixed to down with objectives of 1620, 1610, and 1570 July. Support is at 1620, 1600, and 1570 July, and resistance is at 1660, 1675, and 1700 July. Trends in London are mixed. Support is at 474.00, 470.00, and 467.00 August, and resistance is at 481.00, 486.00, and 487.00 August.

COCOA 

General Comments: Futures closed higher and showed potential to make a new leg up. There was not a lot of news for the market, and price action reflected this. It looks like the buying was based on the charts as New York futures could not move to new lows and in fact have held at an important área on the charts. But, ideas of weak demand after the recent big rally kept some selling interest around. The weather is good in West Africa, with more moderate temperatures and some rains. The mid crop harvest is moving to completion, and less than expected production along with smaller beans is reported. Malaysia and Indonesia crops appear to be in good condition and weather is called favorable.

Overnight News: Scattered showers are expected in West Africa. Temperatures will average near to above normal. Malaysia and Indonesia should see episodes of isolated showers. Temperatures should average near normal. Brazil will get mostly dry conditions and warm temperatures. ICE certified stocks are lower today at 5.113 million bags.

Chart Trends: Trends in New York are mixed to up with objectives of 2480 and 2520 July. Support is at 2340, 2325, and 2280 July, with resistance at 2400, 2420, and 2425 July. Trends in London are mixed. Support is at 1540, 1520, and 1505 July, with resistance at 1575, 1580, and 1600 July.

See the original article >>

Junk Bonds acting rather Junkie of late! Next key move is…

by Chris Kimble

CLICK ON CHART TO ENLARGE

The Power of the Pattern shared that Junk Bond ETF's were creating bearish rising wedges on 5/24, suggesting a two-thirds chance junk bonds would fall in price. (see post here)

The above 2-pack reflects a breakdown in price and a breakout in yields for a Junk bond ETF and a preferred Dividend ETF. Both are nearing short-term support, where a bounce is due!

The key to the bigger puzzle on junk is the inset chart, reflecting that effective yields on Junk are breaking higher (bullish for yields/bearish for price) from a bullish falling wedge and rates are still very low on a historical basis!

See the original article >>

Stock-Market Crashes Through the Ages – Part II – 19th Century

By tothetick

Stock-market crashes saw the light of day more and more as the world became industrialized. The 19th century saw a rapid increase in their numbers.

There’s money to be had at any time, whether the market is going up or down. But, it’s avoiding the downs and pulling out before the things start to go haywire that is important. Or, at least, investing in what’s good and what’s going to take a hike. But, how can you believe what people have to say? The only ones who are any good at selling a rise when in actually fact it’s a fall coming are the marketing gurus themselves. They are more common than we might think. It’s no modern invention either. We are past masters of selling what doesn’t exist. Selling make-believe is what makes people happy, until it takes a turn for the worse.

Some might say that predicting the downturn in the market can be done. You can develop algorithms and have sophisticated math, analyzing stock movements in multiple countries at the same time with split-second data churning out. You can use whacky ways to predict what’s happening if you can’t tot up the equations and come to a decision, like seeing how many toothbrushes are sold in the economy (as people tend to stop going to the dentist when there is a crisis). Although they are more likely to reveal what’s actually taking place, than what is going to happen just round the next corner.

Use as much economic forecasting as you like but the market won’t react always how you expect it to. We all know that. If it were an exact science, nobody would be poor. If it were a science at all, we would all be damn wealthy, wouldn’t we?

But, looking at what happened in the past sometimes helps us see what we are still doing today. We didn’t invent everything and we might think that we are high-flyers. But, somebody’s been there, done it and seen it all before. The 19th century was the industrialized world at its first beginnings. Trade, transport, better communication and money-making were high up on the agenda.

Here are the best (or the worst, depending on which side of the fence you are sitting) examples of stock-market crashes of the 19th century from the mammoth list that could be mentioned. The majority took place in the USA, which was at the heart of industrialized prowess at the time; a place where money could be made hand over fist, but where it could be lost twice as quickly. The John-Dos-Pasos world of disillusion and hope of classes in the race to become rich and somebody, a household name:

Panic of 1819

If you were told that the Panic of 1819 was due to the issuing of paper money and over-speculation of land, then you might have the impression that we are back in 2008-2012 and the financial crisis and the quantitative easing methods of today. But, no! The Panic of 1819 was due to the fact that Britain and France had been at war for decades, even centuries. They both had a need for US-produced goods and in particular agricultural products were very much in demand. Thanks to the warring between these two countries, the United States was able to become a major supplier and it prospered. However, when war ended things took a dive for the US. Europe was no longer in need and there was a bumper crop in 1817 in Europe leaving the USA in the lurch.

  • Americans had been buying up land at rates that had never been seen so as to produce in what looked like a booming industry.
  • In 1815, 1 million acres of land were sold off to the people.
  • By 1819 that had increased to 3.5 million acres.
  • All of it, of course, was purchased via loans. As things took a nose-dive, the people were unable to pay back their loans. Sounds like the credit crunch and the sub-prime crisis.

You would have thought that we would have learnt our lesson back then, wouldn’t you? But, no, we did the same thing: lending to people in times of economic boom, even to those that are going to be unable to pay it all back.  The banks ended up demanding immediate repayment so they didn’t end up losing out. Sound familiar?

  • Prices of agricultural products were plummeting while the plantation owners were over-producing due to having bought up too much land.
  • Land prices fell and brought the economy down as the banks called in those loans.
  • Bank credit was restricted, loans were cancelled and the Bank of the United States started printing money to deal with the lack of funds.

The printing presses went into action and the rest is history. Almost exactly what has happened today, isn’t it? Didn’t the people who decide study the Panic of 1819?

It was all down to a chain of events, the war between two countries, the reliance on another and suddenly when they are no longer at war they do a runner leaving the country that helped them out to do their own thing. But, isn’t all fair in love and war?

Perhaps the only good thing that came out of the panic was the understanding that there had to be some sort of poor relief for the people that were left destitute and the US education system was also created.

Panic of 1837

It was the USA’s trading relations with Great Britain that caused the panic of 1837 to take place in the US once again. Those Brits have a lot to answer for, I hear you say. They were economic leaders in the world (back then) and what they did had a great effect on what the rest of the world either did or what happened to others. Secondly, there were few trade barriers and that meant that the effects of liberal economics with little restraint based purely on supply and demand meant that changes were made almost immediately and put into effect.

The story goes like this.

  • Britain was suffering from a slump in its agricultural production and ended up relying heavily on the USA, especially in terms of cotton and crops.
  • The US agricultural industry was booming and so British investors placed their money where they were going to get the best returns.
  • However, they didn’t bank on the fact that the Bank of England would increase interest rates (from 3% to 5%), in an attempt to replenish their diminishing reserves.
  • The money that had been invested in the US by the British investors suddenly flowed back into the coffers of the Bank of England.
  • The US was left only with the choice to do exactly the self-same thing in a copy-cat scenario.

A bit like bailing out the banks in the financial crisis. You start one and then everybody has to do it, don’t they? Or if you start baling out one country suffering from financial instability and the consequences of rising debt, then you can never let up and you can’t say no to the others. Then you are really done. Isn’t that where we are at now?

Bank of England

Bank of England

The US raised interest rates and there were restrictive credit policies. Money was in short supply and printing presses started up again to inject money into the economy. Politicians and Bank of the United States’ officials refused to make public addresses and people buried their heads in the sand thinking it would blow over.

Cotton prices shot through the roof and so did land prices. The effect was almost the same as in the 1819 panic: land prices and inflation in general. The result was catastrophic for the USA and ended up going well into the mid-1840s.

Panic of 1857

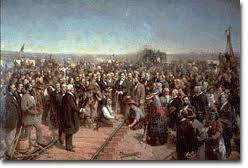
The 1857 panic is commonly known as the world’s first global financial crisis. By the 1850s, travel had gone through great changes. Railroads were already at their height of use and transport in trade was faster and better than it had ever been before.

Once again, it started in Britain at the time. Looks like Britain was the USA of yesterday, the financial-crisis instigator of the world at the time. Tough to carry that burden on your shoulders, but one saving grace is that people forget who, why and when very quickly just as soon as the next crisis comes along. Otherwise we wouldn’t be repeating history over and over, would we?

  • The British government in 1857 did (and succeeded) everything in their power to get around the Peel Banking Act of 1844, requiring that gold and silver back up the money that was in circulation.
  • The panic that ensued in Great Britain spread rapidly to the US and it was the Ohio Life Insurance and Trust Company that caused the triggering of the panic in 1857 in the US.
  • It was all down to fraudulent activities of the bank’s executives that there was a bank-run in 1857.
  • The bank suspended activities after incurring losses of $7 million.
  • They had lent too much money to railroads in the conquest of the west.
  • However, it was in 1857 that the flow of people to the west had considerably slowed down.
  • They had over-lent to railroad companies and they didn’t have enough gold or silver to back it up, just like in Britain.
  • The value of land fell, the railroad securities disappeared.
  • The banks went into meltdown.

Once again, the banking system had lent too much in times of economic prosperity, and they didn’t have enough to back it up. The railroads also went into meltdown and so did the farmers. Land prices depreciated and crops became almost worthless (grain hit the floor at $0.80 a bushel, spiraling from the dizzy heights of $2.19).

Railroads in the USA

Railroads in the USA

It was the Panic of 1857 that partly resulted in the American Civil War a few years later. The north had suffered immensely from the drop in prices. The south had not suffered quite so much.  The south became stronger in the relationship between the two parts of the USA, but tensions grew to the widening disparity between the wealth and the problem of slavery that was central to their dispute.

Panic of 1873

This time it was another world recession that became the first one that was known as the ‘Great Depression’ until an even greater one came along in the 1929 and then it was relegated to the back-burner, forgotten. It was a depression that was triggered by Germany this time and their decision to get rid of the silver standard. It put an end to Great Britain’s hegemony in the world.

  • Bank reserves had been put under a great deal of strain from money that had been lost in the construction of railways as well as due to speculative investments and property-sector losses that hit hard. The railways were the dot com bubbles of the 1990s and 2000s. Massive investment, euphoria, then a pin prick, and it all deflated.
  • The German decision to stop using silver to mint coins resulted in a fall in prices in the USA, where most of the silver was exported from at the time. Due to the fall in demand, the Coinage Act was passed and meant that the US used the gold standard. Silver lost even more in price.

The Germans instigated the move away from liberal free-market policies towards ones that were more conservative.

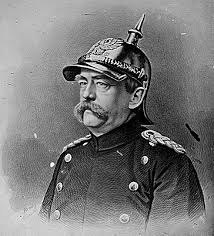
Otto Von Bismarck

Otto Von Bismarck

Bismarck as Chancellor nationalized industries and even created the social security system to provide workers with pensions so that they state wouldn’t have to pay for them at retirement age (which was later exported all around the world, until it became too much for us to finance).

Conclusions

The panics happened every twenty years and then towards the end of the 19th century they accelerated closing the gap between each panic as we became more industrialized, more dependent on travel, transport and communication became faster and faster. There were other panics that occurred in 1884, then again in 1893 and 1896. Panic was synonymous with the world that the 19th century had wafted in on the railroads that they were building. But, it wasn’t a patch on what the 20th century had in store as the panics and crashes became more and more recurrent.

So, are there reasons why the stock markets created so many bubbles that bust in the faces of our 19th-century ancestors? That was probably because there was a major rise of the middle-class in the 19th century. It wasn’t just the select very few that were from the higher echelons of society that were going into business. Making money, rather than inheriting it was the order of the day for the first time in the 19th century. The Industrial Revolution had brought entrepreneurship into the living rooms of the middle classes on a steam train. It had opened doors in communication, transport and energy. There were opportunities to be had in every sector and there were at last more than just that select few who were ready to make a buck.  There was also reduced interference by the state and the beginnings of the forging of the system in which we live today. Risks were taken. Whether they were calculated risks or not is entirely another matter? But, it was the 19th century when industrialization meant opportunity and yet still at the same time a working class that was not adequately organized to defend itself or demand more than the entrepreneurs allowed them to.

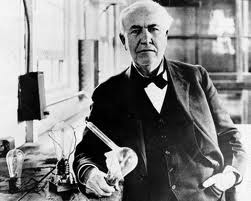
Thomas Edison

Thomas Edison

The list of entrepreneurs that stands witness to the 19th century’s success is endless. The Edisons and the Carnegies, the Rockefellers and the Vanderbilts are still today almost as strong as household names, aren’t they?

See the original article >>

Hedge funds may be retreating from ag commodities

by Agrimoney.com

Hedge funds may be in retreat from agricultural commodity markets - with a "disastrous" bet on corn futures adding to the pressures on profitability raised, ironically, by their own success, a former Chicago Board of Trade director said.

Ann Berg, also the first recorded female grain exporter, said that the retreat in hedge funds' net long positions in major US-traded agricultural commodities in April to their lowest since 2006 may be a sign of waning interest in the sector.

In particular, she flagged that the drawdown – which has since reversed somewhat – came even as agricultural commodity prices rose, appearing a signal that "funds were sounding a retreat from the sector".

The position data "do illustrate a change in hedge fund behaviour", said Ms Berg, now an advisor on crop markets to governments and organisations such as the FAO, the UN food agency.

'Long bet turned disastrous'

A withdrawal would be consistent with hedge funds' declining profitability from crop positions.

Commodity hedge funds recorded negative performances in both 2011 and 2012, disappointing investors who withdrew about 20% of their cash last year, according to Newedge.

"By 2011, the performance of the commodity hedge funds declined and their positioning in agricultural futures no longer seemed to be predictive of market trends," Ms Berg said, with speculators appearing to have been caught out particularly this year in the Chicago corn market.

"Hedge funds enlarged their long position in corn in anticipation of a bullish US Department of Agriculture planting intentions report.

"The long bet turned disastrous when, in March, the USDA announced potential record corn production for 2013, causing a two-day sell-off of about $40 a tonne."

Volatility factor

Hedge funds have also been victim of their own success, in muffling the volatility which the exploited to great profit during the crop price boom and bust in 2008-09.

Hedge fund algorithms "might have been instrumental in reducing the level of price volatility… especially those specializing in arbitraging market anomalies," Ms Berg said.

"High volatility – peaking at 80 during the food crisis five years ago but declining to levels around 12–20 for most of the past year and a half – was most likely a significant factor in commodity hedge fund success in years past."

The comments came as the UN FAO itself forecast calmer grain markets ahead, thanks to the prospect of a rebuild in world cereals stocks to their highest in 11 years.

See the original article >>

Oil falters with rising inventories and falling demand projections

By Phil Flynn

The bonds are back and were going to be in trouble! Rising yields may yield to fear as the Japanese stock market starts to melt down. Japan's central bank just did not get the fact that it was the massive stimulus that was giving their markets some semblance of hope. Now with the Fed threatening to taper bond purchases, taking away an important flood of cash from emerging market and a scary World Bank forecast it is clear that Japan’s economic woes are clear for all to see.  That may force the dollar back down and yields higher as turmoil in global markets may force the Fed to reassess the timing of the taper.

The World Bank lowered the world growth forecast down to 2.2% down from 2.4%. That comes as it is being reported that the dollar is moving in the best lockstep position with stocks since the days of the financial crisis began.

Yesterday crude reacted to a bearish report by the Energy Information agency by trying to rally. Warnings that crude supply could tighten by the International Energy Agency also gave bulls reasons for hope, yet OPEC is warning of potential threats to the oil market's balance and reported an increase in its own output in May. North Sea problems and geopolitical risk has kept Brent Crude solid. The Wall Street Journal is also reporting on how important the Fed is to the price of oil. The WSJ says that "There is a shadow looming over oil prices in the shape of a big tank — and a big central bank. At around 394 million barrels, U.S. commercial stocks of crude oil, excluding the strategic petroleum reserve, are hovering around their highest levels since the early 1980s. In part, that reflects the shale-led surge in U.S. supply, with domestic production outpacing imports in late May for the first time since January 1997. In its latest monthly report, issued Wednesday, the International Energy Agency forecast U.S. output would top 10 million barrels a day on average this year, up 23% in just two years.

Meanwhile, domestic demand is sluggish. The IEA expects it to average slightly less than 18.6 million barrels a day this year, down for the third year in a row. The trend of Americans buying more fuel-efficient cars and driving less is holding down consumption. Back in 2005, Americans burned almost 21 million barrels a day. But another factor keeping inventories high has nothing to do with roughnecks or commuters. It emanates from Washington. Refiners and oil marketing and trading firms keep stocks on hand to ensure they can supply customers. Low interest rates, facilitated by the Federal Reserve's policy of quantitative easing, make it cheaper to finance those inventories. Indeed, those low rates can make it very profitable to buy oil, store it and lock in a margin by selling futures.

Energy economist Phil Verleger estimates that with short-term interest rates around 0.25% — roughly in line with Libor — the financing cost of holding stocks today is around two cents a barrel every month. Right now, three-month oil futures trade at about a 30 cents a barrel premium to the spot price. On that basis, assuming 90% leverage, an investor could buy oil and sell it three months forward, earning a 2.5% return after costs. That might not sound like much. But it is five times the yield on the three-month U.S. Treasury and a no-brainer for a trader at an oil firm with access to storage capacity. But the trade is getting squeezed over time. Back in February, the spread was around $1 a barrel, implying a return over three months of almost 10%. While spot prices have held pretty steady over the past few years, futures further forward have been slipping, likely reflecting rising expectations for U.S. supply and acceptance that the global economy's recovery will be a gradual, drawn-out affair. The upshot is that, with bond yields rising as the end of quantitative easing becomes a more realistic prospect, profits on the carry trade are likely to shrink further. The same trade described above at current spreads but with a 1% financing cost earns a return over three months of less than 0.7%. As this squeeze becomes more apparent, it can become self-fulfilling as those holding inventories sell them in the expectation that futures will decline further. That liquidation adds further pressure to prices as it increases available supply. Say 50 million barrels were liquidated over the second half of the year, which would simply bring U.S. inventories down to around their five-year average. That would amount to almost 274,000 barrels a day. To put that in perspective, it equates to about a third of the IEA's expectation for global oil-demand growth this year. The past few weeks have seen yields rise globally as bond investors raise their expectations of the Fed taking its foot off the gas. Oil investors won't be immune."

See the original article >>

Follow Us