Monday, September 5, 2011

Telegraph Reports Italy Needs to Rollover Record €62-Billion of Bonds in September; On September 7, German Court Rules on Bailouts

by Mike Shedlock

The Karlsruhe-based Federal Constitutional Court will announce its verdict on September 7 at 4 a.m. EDT, it said in a statement on Tuesday.

The court is considering three lawsuits brought by six eurosceptic plaintiffs -- five academics and a lawmaker from the Bavarian sister party to Chancellor Angela Merkel's Christian Democrats -- against German-backed international bailout schemes for Greece, Ireland and Portugal.

The plaintiffs argue that the bailouts, which total 273 billion euros ($393 billion), violate property rights and other protections in the German and European constitutions, and break the "no-bailout" clause in the European Union's treaty, which says neither the EU nor member states should take on other governments' liabilities.

Legal experts believe the court is extremely unlikely to block Germany's participation in the multi-year bailouts, or in an additional 109 billion euro package of official aid for Greece that euro zone leaders announced last month.

However, many legal experts and some government sources say they expect the court to set conditions for German participation in future bailouts, perhaps giving the German parliament a bigger say in approving it. That makes the court's verdict key for the whole euro zone.

For example, the eight judges could require German contributions to the European Stability Mechanism, the planned regional bailout fund which will start operating in 2013, to be subject to a vote by Germany's parliament. Currently, this is not formally mandated.
Any changes, even parliamentary approval will leave the door open at a later date for saying enough is enough.

Biggest Ever Italian Bond Rollover in September

The Telegraph reports Italy needs to rollover €62-billion of bonds in September. The Globe and Mail claims €46-billion.

Either way, September will be a big month.

Please consider German endgame for EMU draws ever nearer.
Finance minister Wolfgang Schäuble could hardly have chosen a more toxic term than "Bevollmächtigung" or general enabling power when he requested blanket authority from the Bundestag for EU rescues, as if Weimar were so soon forgotten. He was roundly rebuffed.

You can feel the storm brewing in Germany. Within days of each other, President Christian Wulff accused the European Central Bank of going "far beyond" its mandate and subverting Article 123 of the Lisbon Treaty by shoring up insolvent states, and Bundesbank chief Jens Weidmann said bail-out policies had "completely gutted" the EU law.

Both believe the EU Project has taken a dangerous turn. Fiscal powers are slipping away to a supra-national body beyond sovereign control. "This strikes at the very core of our democracies. Decisions have to be made in parliament in a liberal democracy. That is where legitimacy lies," said Mr Wulff.

We will find out to what extent Germany’s constitutional court shares these fears when it rules this Wednesday on the legality of the EU rescue machinery, and delivers its verdict of life or death for monetary union.

The assumption this time is that the eight judges will insist on beefed up powers for the Bundestag, but will not disturb the existing nexus of bail-outs and bond purchases. That is the most likely outcome.

Whether they go any further is the existential question for EMU. If they rule that the permanent bail-out fund (ESM) after 2013 breaches treaty law, they will queer the pitch greatly since the viability of the current fund (EFSF) depends on a hand-over.

If they rule in any significant way that the EFSF itself breaches Lisbon’s `no bail-out’ clause, or even that Germany cannot participate until the Treaty is changed, market confidence in monetary union will collapse instantly.

Whatever the court does, the simmering revolt in the Bundestag over recent weeks lays bare the salient strategic fact that Germany is not about to embrace fiscal union or quadruple the EFSF to €2 trillion, as deemed necessary by City analysts and EU officials to stabilize Italy and Spain. Nor will it pay for a third Greek rescue.

The EU-IMF Troika left Athens abruptly on Friday, blaming Greece for failure to comply. The equal failure is the scorched-earth austerity policies imposed by the EU itself. Fiscal deflation cannot work in a rigid economy with a large trade deficit and a high debt stock. It ensures a Fisherite debt deflation spiral.

The IMF must know from its errors in Argentina a decade ago that Greece needs a 40pc devaluation and 50pc debt forgiveness to claw back to viability. Yet the EU has blocked both, and the Fund has until now acquiesced.

Needless to say, battered banks, insurance companies, and pension fund will not wait for further rounds of punishment. They know that Italy must redeem €14.6bn of debt this week and €62bn by the end of September, the highest ever in a single month. It must roll over €170bn by December.

The ECB can in theory hold the line by soaking up the entire public debt of Italy, the world’s third largest at €1.84 trillion. The question is whether it can plausibly act on such a theory when the president of EMU’s dominant power deems this to be illegal.
Troika Abruptly Walks Out of Talks in Athens

In case you missed it, last Friday Inspectors leave Greece after talks are suspended

THE STRUGGLE to keep the ailing Greek economy afloat took a further turn for the worse as the EU-IMF “troika” abruptly suspended talks in Athens on the release of the next round of rescue aid to the country.

A team of troika inspectors unexpectedly left Greece yesterday after the emergence of divisions with the government over the execution of reforms agreed in its first international bailout.

With the release of each round of bailout loans contingent on the delivery of agreed reforms, the latest breakdown raises fresh questions about the government’s capacity to implement the rescue plan.

The dispute comes as Greece tries to persuade private creditors to bear investment losses as a condition of its second bailout. The terms of the second rescue were finalised in July after months of dispute which intensified the sovereign debt crisis.

With Italy and Spain under pressure, the latest turmoil in Athens unsettled bond markets yet again. Greek two-year bond yields soared to a new record of more than 46 per cent and Italian and Spanish borrowing costs also rose.

The troika – comprising the EU Commission, the ECB and the IMF – sent an inspection team to Athens a fortnight ago for the fifth quarterly review of the first Greek rescue. Top officials from the three institutions joined talks with Greek ministers on Monday but the deadlock persists.

“At a certain point you reach the conclusion that there is no point in having new meetings every day – and you leave the Greeks a chance to do their homework,” said a source close the troika.

At issue is the Greek government’s failure to deliver promised reforms to public sector pay and its tax collection system. The troika is also unhappy with the government’s failure to liberalise a number of professions.

Although the IMF had hoped to wrap up the talks next Monday, the troika said yesterday that its inspectors now expected to return to Greece by the middle of the month. It wants Athens to complete technical work by then and to continue talks on policies needed to complete the review.
Can Italy rollover debt without help from the ECB? I highly doubt it, but we are about to find out.

There is lots of Eurozone action in September, that's for sure.

Wall Street Banks: Too Big To Blame For Subprime?


Goldman Sachs has historically been one of the more bullish investment houses on Wall Street, but the firm has recently taken a dark macro view. The Wall Street Journal reported on Sept. 1 that Goldman issued a 54-page report sent to their institutional clients on August 16th arguing that as much as $1 trillion in capital may be needed to shore up European banks; that small businesses in the U.S., a past driver of job production, are still languishing; and that China’s growth may not be sustainable.

The trading ideas suggested by Goldman,
"....a fancy option play that offers a way to take a bearish position on the euro, and a bearish bet through an index of insurance contracts on the credit of European financial stocks."
But Goldman is also facilitating sales of Spanish sovereign bonds. From WSJ:
".....On Wednesday [Aug. 31], Goldman and two other major banks hosted a presentation in London in which the Spanish economics secretary, Jose Manuel Campa, planned to outline Spain’s fiscal austerity measures and pitch Spain’s case to investors, according to an invitation seen by The Wall Street Journal. Goldman has a leading position among banks in facilitating sales of Spanish sovereign debt."
Furthermore,
"Goldman's own trading positions potentially could benefit if hedge funds and other clients make trades based on the report. Goldman says in bold letters at the top of the report that other Goldman traders, or "Goldman Sachs personnel," may already have acted on the material in the report."
So what that means is that Goldman is already in positions and is front-running their clients. Now that's really delivering the promise of putting the interests of clients first. Moreover, there could be some potential conflict of interest.

That is, on one hand, Goldman is getting compensated to market the sovereign bond of Spain, but on the other hand, Goldman has put in positions and advised its big clients to bet against the Euro and European banks, which is, in essence, betting against the Spanish bond the firm is supposed to facilitate sales, albeit indirectly.

So, it'd be very interesting (and entertaining), to say the least, to be a fly on the wall to listen to what Goldman's response would be when challenged by the potential investors of the Spanish bond with questions such as "Are you sure we should buy these bonds? You guys are pretty bearish on the Euro and European banks and are supposedly betting against them?"

An even better question is when Goldman would reverse its recommendation whenever the situation suits (and release it to the media and general public) as it did within a-month time on commodities and crude oil in April and May this year leaving the majority of regular investors holding the bag, while the firm would be most likely already positioned to benefit from the resulted market reaction...."Chinese Wall" notwithstanding.

This came just two months after Goldman has reportedly received a subpoena in June 2011 from the office of the Manhattan district attorney "stemming from a 650-page Senate report from the Permanent Subcommittee on Investigations that indicated Goldman had misled clients and Congress about its practices related to mortgage-linked securities."

You might recall prior to the 2008 financial crisis, Goldman Sachs, along with some other big Wall Street banks were peddling complex synthetic collateralized debt obligations, or CDO’s (the more infamous one is Goldman's Abacus 2007-AC1). These big banks then not only made short bets, but also pitched their hedge fund and institution clients to bet against the housing market, and pocketed huge fees and profits.

In April 2010, the U.S. SEC (Securities and Exchange Commission) did file a civil fraud law suit against Goldman for creating a mortgage product that was intended to fail. But Goldman settled with the SEC in June 2010 for mere $550 million (Goldman's gross profit is $39.16 Billion for the past 12 months)...... without admitting or denying guilt.

Not to worry, along came the latest party pooper of Wall Street banks--the FHFA (Federal Housing Finance Agency)--the federal regulator that placed Fannie and Freddie into conservatorship about three years ago. In a bit to recoup billions of dollars in losses from failed subprime mortgage bond investments, after filing in July against UBS AG, seeking $900 million in damages, the FHFA went on and sued some of the biggest banks on Wall Street on Sept. 2 (See the list below from WSJ):
  • Ally Financial (ex-GMAC), $6 billion
  • Bank of America Corp., $6 billion
  • Barclays Bank, $4.9 billion
  • Citigroup, $3.5 billion
  • Countrywide, $26.6 billion
  • Credit Suisse Holdings USA, $14.1 billion
  • Deutsche Bank, $14.2 billion
  • First Horizon National, $883 million
  • General Electric, $549 million
  • Goldman Sachs, $11.1 billion
  • HSBC North America, $6.2 billion
  • J.P. Morgan Chase, $33 billion
  • Merrill Lynch/First Franklin Financial, $24.853 billion
  • Morgan Stanley, $10.58 billion
  • Nomura Holding America Inc., $2 billion
  • Royal Bank of Scotland Group, $30.4 billion
  • Societe Generale, $1.3 billion

The FHFA waited till the 11.5th hour to file these suits with the filing deadline approaching this month. I'd imagine the FHFA is taking its time to collect enough ammunition since most of these big banks have some of the country's top lawyers either on staff or on retainer.

The amounts in the FHFA's suits weighed on the financial stocks on Friday, Sept. 2 (See Chart Below), and could get worse for these banks as things progress.
Chart Source: WSJ.com

In Goldman's case, the firm has one more advantage beyond the high-priced attorneys. The revolving door between Goldman and the U.S government has resulted in quite a few Goldman alumni and affiliates in high government places....four dozen, according to CBSNews.

Reportedly, there were critics saying the lawsuits represent a "piling on" by federal and state regulators that threaten to crimp credit and undermine a housing recovery. Granted over-regulation does present impediment to business, but there has to be a check and balance in the system.

WSJ notes the FHFA suits represent "the most sweeping action to date from a federal regulator stemming from the mortgage meltdown." Since government agencies have resources and power unavailable to regular investors, it'd interesting to see how these FHFA suits unfold. Nevertheless, if history is any indication, the most likely outcome could be settlements without admitting guilt.

And judging from the civil actions brought by the government agencies so far, it would seem that either the U.S. financial regulation system could use a fast and furious overhaul to have some real legal power to hold these big banks accountable for any subprime-like mess, or the U.S. banking structure and the sector's political clout has morphed it into one that's too big to regulate or reform.

SPY Trends and Influencers September 4, 2011


Last week’s review of the macro market indicators looked like the unofficial last week of Summer would bring Gold ($GLD) to bounce around in its uptrend while Crude Oil ($USO) slowed at resistance and turned lower. The US Dollar Index ($UUP) seemed content to move sideways while US Treasuries ($TLT) were biased lower. The Shanghai Composite ($SSEC) and Emerging Markets ($EEM) were biased to the downside with risk of the Chinese market running a little higher first. Volatility ($VIX) looked to remain elevated keeping the bias lower for the equity index ETF’s $SPY, $IWM and $QQQ, despite the moves higher the previous week, with the $QQQ looking to have the best chance to break the bear flags higher.

The week began with Gold meandering sideways and Crude Oil hitting the breaks at resistance. The US Dollar Index was behaving as anticipated but US Treasuries were finding some support. The Shanghai Composite drifted lower while Emerging Markets caught a bid and moved higher. Volatility tailed off but only marginally as the Equity Indexes SPY, IWM and QQQ rose. And then Friday happened pushing Gold and Bonds higher and Crude Oil and Equities lower. How does this impact the view for the week ahead? Let’s look at some charts.

As always you can see details of individual charts and more on my StockTwits feed and on chartly.)

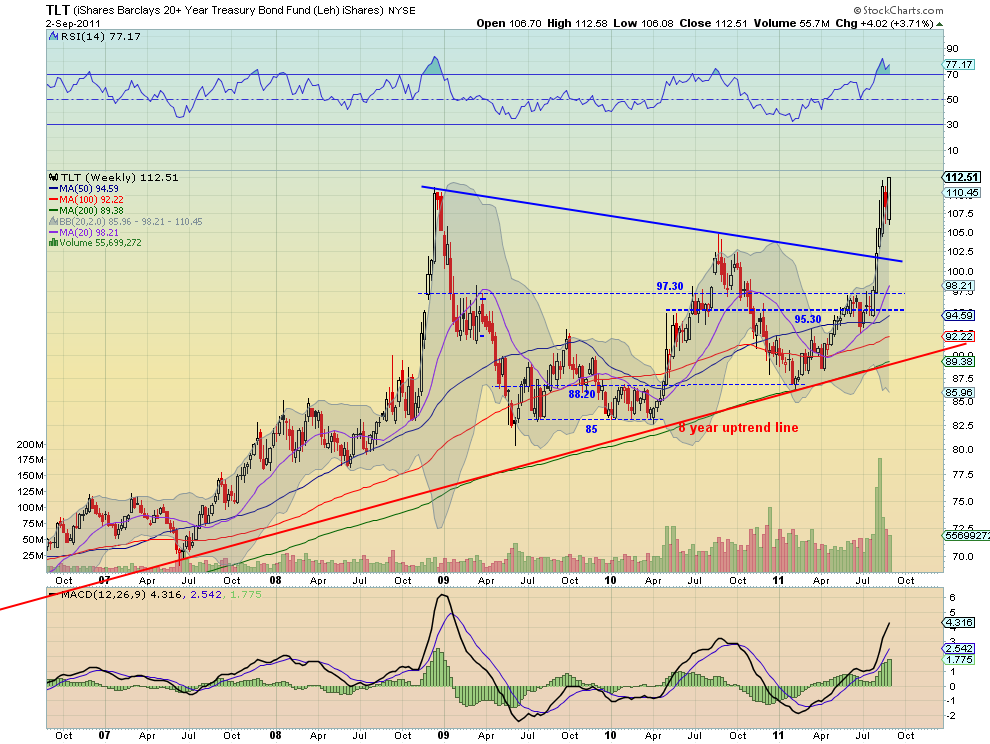
iShares Barclays 20+ Yr Treasury Bond Fund Weekly, $TLT

US Treasuries, as measured by the ETF $TLT, consolidated higher for most of the week before breaking to new highs on Friday. The RSI is in bullish territory and currently rising while the MACD has moved back to the zero line and looks ready to cross higher, on the daily chart. The weekly chart shows a strong white candle closing nearly on the high in a bull flag. The RSI is elevated but not extreme at 77.17 and the MACD continues to increase. Look for more upside in Treasuries next week with targets higher on a MM to 120.70 and then 137 from the symmetrical triangle pattern breakout on the weekly chart. Any downside move should find support before 104.80 at either 108 or 106.

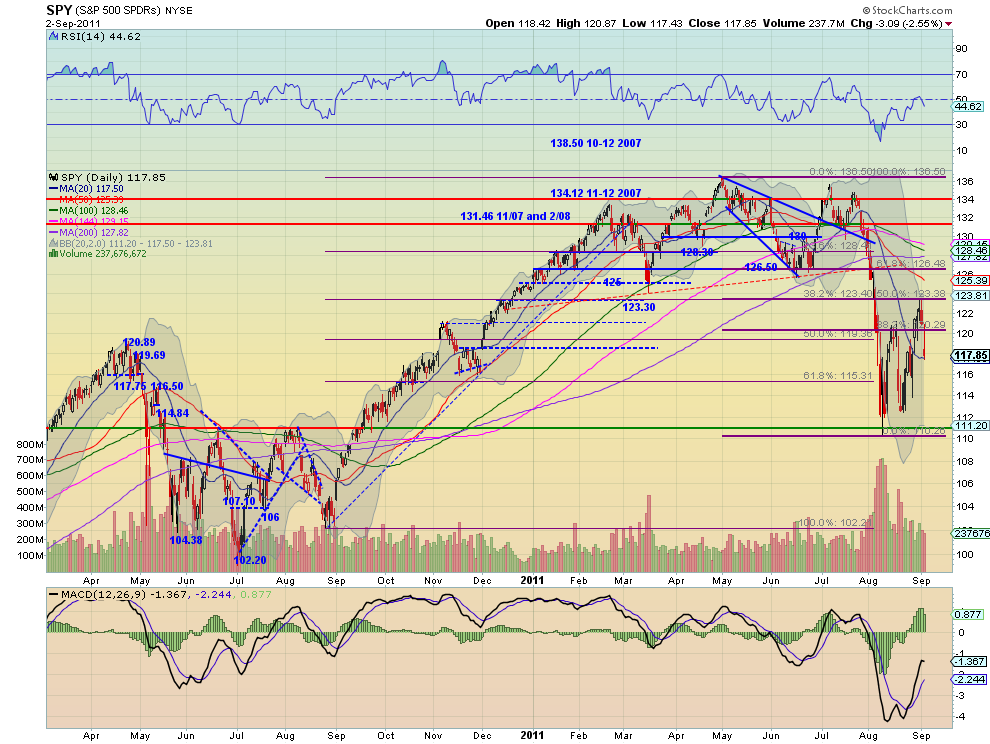
SPY Daily, $SPY

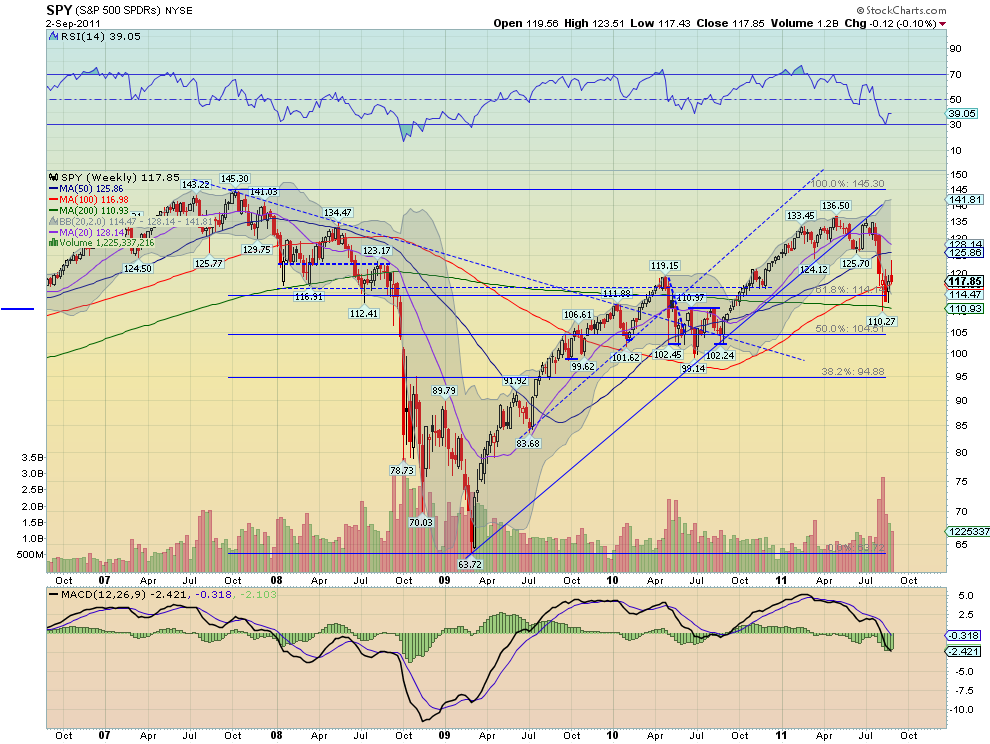
SPY Weekly, $SPY

The SPY rose early in the week but fell hard Friday after printing a Tweezers Top with topping tails halting at the 20 day SMA. The RSI on the daily chart turned lower at the mid line and the MACD is waning. On the weekly chart the long upper shadow may be foreshadowing more down side out of the bear flag. The RSI however is rising off of the low and the MACD is improving on this time frame. The trend is lower and look for that to continue next week with any upside move held at 121.50 or 123.40 above that. Any more and the down trend is in question. To the downside if support at 112.4 does not hold then the next levels down for support come at 111.15 and 104 on the way to the MM target of about 95.

Next week looks like the moves that revealed themselves Friday will continue. Gold and US Treasuries are ready to continue higher. Crude Oil looks poised to drop further and the US Dollar Index to move sideways in the top of its range. The Shanghai Composite and Emerging Markets look to continue lower. Volatility looks to continue elevated with the US Equity Index ETF’s SPY, IWM and QQQ ready to continue lower in their bear flags. US Treasuries breaking out and Gold racing higher again could be the catalyst for a break of the bear flags lower. Use this information as you prepare for the coming week and trade’m well.

It’s All About the Jobs… and Gold

By John Mauldin

The Flat Earth (Employment) Society
Let’s Do a Little Time Travel
The Implications of an Older Workforce
How Do We “Fix” the Employment Problem?
Some Thoughts on Gold
Europe, New York, Conferences, Etc.

This week we briefly look at yesterday morning’s dismal unemployment report, then drop back and survey some other very eye-opening data on employment. Some groups are (surprise) doing better than others. What would it take to get us back to “normal,” whatever that is? I give you a link to some webinars I will be involved in and finish with the answer to the question I am asked most often, “What do you think about gold?” I tell all. There are lots of topics to cover, so let’s get started with no “but firsts.” (Note: this e-letter may print out rather long, as there are LOTS of charts and tables.)

The Flat Earth (Employment) Society

Unless you were completely out of touch this weekend, you know the jobs report came in flat, as in zero, nada, “0”. The economy was in neutral, at least as far as employment was concerned. But flat is actually down, as we need 125,000 jobs a month (at least) just to stay up with population growth. And, as we will see in a few pages, it may well take more than that.

Yes, there was the caveat that 46,000 Verizon workers were on strike, so the number should have been a positive 46,000. But then there were 20,000 returning Minnesota state workers who were “added” back in, so maybe the number should be negative. As it turns out, workers on strike are counted as unemployed when they go on strike (thus subtracting from the jobs number) and are added as newly employed when they go back to work. So sometime in the next month or so, when those Verizon workers settle, the employment report will show a magic increase of 46,000.

The rules for this are arcane. If you go do the BLS (Bureau of Labor Statistics) website – assuming you have no real social life and nothing else better to do – you find that:

Employed persons are “persons 16 years and over in the civilian non-institutional population who, during the reference week, (a) did any work at all (at least 1 hour) as paid employees; worked in their own business, profession, or on their own farm, or worked 15 hours or more as unpaid workers in an enterprise operated by a member of the family; and (b) all those who were not working but who had jobs or businesses from which they were temporarily absent because of vacation, illness, bad weather, childcare problems, maternity or paternity leave, labor-management dispute, job training, or other family or personal reasons, whether or not they were paid for the time off or were seeking other jobs.” (Hat tip, Joan McCullough)

Somehow, strikes don’t count as labor-management disputes. Or personal problems. Go figure. But that is a distortion of the monthly numbers, which is why it is better to look at rolling three-month averages to get a clearer picture. And speaking of three months, the last three months’ job reports were revised down by a total of 58,000 jobs, making the net over the last three months a very small number.

However you look at this report, it was just ugly. Yet it goes along with regional reports that show a contracting economy and the national ISM (which came out Thursday), which is barely above a contractionary number, at 50.6. The ugly part of the ISM number is that this was the third straight month in which inventories rose more than new orders. Historically, as this chart from Rich Yamarone shows, that suggests we are either in or close to a recession. (Note, there are some other negative points, but they were not three months in a row and were not followed by recession.)

The US has roughly the same number of jobs today as it had in 2000, but the population is well over 30,000,000 larger. To get to a civilian employment-to-population ratio equal to that in 2000, we would have to gain some 18 MILLION jobs. The graph below is from the FRED database at the St. Louis Fed. (Kudos to the guys in St. Louis for maintaining such a wonderful source of data for all of us! They have thousands of charts and data sets to maintain and do so with precision, keeping things up-to-the-minute!) Note the precipitous drop in the ratio in the last ten years, especially during the recession.

Let’s Do a Little Time Travel

Close friend Rob Arnott, founder of Research Affiliates, and I often exchange emails on a wide variety of topics. His curiosity is matched only by his ability to come up with new ways to look at old issues. He sent me the following email, which I am simply going to cut and paste as it is only six paragraphs, but it sets us up nicely for the next segment [my comments in brackets].

“John, I looked at the composition of the labor force, men and women. Look at the graph below. From 1948 until 1980, men who considered themselves to be ‘in the labor force’ (working or wanting work) equaled roughly 98% of the male population ages 20-64. [Wow. What a quaint concept. If you could work, you wanted work.] From 1980 to 2005, this proportion fell steadily, from 98% to 92%. Then, in six years, it fell again by half this margin, to 89%. As for male employment, it averaged 94% of the population age 20-64, until the 1975 recession. Today, it’s 81%. Let’s assume that the old labor force ratio of 98% could, in fact, work. That means that male unemployment – including those who have given up on the idea of gainful employment – is over 17%, and is roughly tied with the levels of mid-2009.

“For women, society evolved from predominantly ‘homemaker’ employment to a point, about a decade ago, where women in the labor force equaled about 82% of the female population aged 20-64. The women in the labor force have dropped from 82% to 78% in ten years, with most of that drop in the past two years; that’s 5% of the female workforce that’s simply given up in two years. Using the prior peak of 82%, as the roster who would want to work, the current 71.6% who are working implies that female unemployment is roughly 13%, and is much higher than it was two years ago.

“Combine the results, and we get a figure of 15% unemployment, give or take, relative to past peak labor-force levels, if we include those who have given up hope. Add in the usual U-6 vs U-3 comparison (including those who are part-time and want full-time work), and we’re at about 20% true unemployment.
“The good news, is that if our natural “labor force” is 98% of the men and 82% of the women, and if ‘full employment’ puts 95% of them in jobs, we have about 25 million new jobs that could be created. If we get out of the private sector’s way, and allow employers to hire who they want, doing work that both parties agree to do, for pay that both parties find acceptable. I.e., enlightenment in Washington (and Sacramento) could unleash a tsunami of new employment.

“Caveats: Of course, there were some teenagers and a few senior citizens in the labor force. So, in theory, the ratio of labor force, relative to the population age 20-64, could even top 100%. But, this ratio is pretty relevant, since the overwhelming majority of men in the labor force would be 20-64. I also made a simplifying assumption that the population of people aged 20-64 is evenly split. I know there are more women than men, but that’s mostly because women live longer. Indeed, under age 20, the split is about 51.5/48.5 male majority. So, I think this is a fair assumption that the populations are about equal in the working-age cadre, until we can track down more accurate information. Either way, it’s not going to make more than a slight difference in this analysis.”

The Implications of an Older Workforce

While doing some research on Google for today’s letter I came across a new (to me) web site called Metric Mash (http://www.metricmash.com/). It accesses public databases and allows you to slice and dice data on an assortment of things, including employment. It is now one of my new favorites. I could do a year’s worth of letters on the charts and graphs I can create there. Way cool.

But I will limit myself to three this week. The only “limit” I found was that I can only create a chart with four comparisons, and I wanted to use six. Six graphs, that is, of different age groups and their employment rates. So for this letter I created two “overlapping” charts. The first covers four age groups, 16-19, 20-24, 25-54, and 55+, for the last five years. It will not come as any surprise to parents with older teenagers that the rate of unemployment for them is three times higher than for those over 55. And don’t even think about the employment problems of black or Hispanic young males.

As it turns out, if we break it down to ten-year cohorts, we find each group with higher employment rates, except that recently the 34-45 group is slightly above the 45-54 group.

I was sharing these thoughts with Rich Yamarone (Chief Economist at Bloomberg), and he said, “Let me send you this chart.” It is a chart of people who are 75 or older who are working. The numbers are on the rise. They are literally double what they were just 15 years ago. 1.2 million people over 75 are in the US work force, which is getting ever closer to 1% of the total working population. It is not just Greenspan and Richard Russell!

This is consistent with what I wrote a few weeks ago. The Boomer generation is healthier and going to work longer than any previous generation. Part of that is because some of them need the income, but some of it is simply that they work because they can and like to. They simply have no reason to want to “retire”; they like the social interaction and the activity.

But that means they are not giving up jobs that younger people traditionally take. Go into Barnes and Noble; look at the workers and think back about ten years. Tiffani worked at Barnes and Noble when she was in her late teens, and I admit to going to B&N just to walk and look and browse, even though I read most of my books on my iPad. I still like trolling the aisles looking for something new. But now the people behind the counter are close to my age (I am 62 next month) or older.

There is a lot to be said for older workers. They are usually more dependable, as they don’t go out at night as much, have a larger set of work experiences, and so on. But if more and more Boomers stay in the workforce, the number of new jobs needed to get back to what we think of as “full employment” will be just that much higher. Think about it. If only 25,000 Boomers don’t retire each month (not a stretch) for another ten years, that adds 300,000 jobs a year we need just to break even. That is 20% more than we currently think of as the minimum number of new jobs needed per month (125,000). Talk about moving the goal posts just as we start to get there!

And that brings us to the last chart from Metric Mash, which compares the employment rates of people with four different levels of education. While the unemployment rate for those with college degrees is much higher than five years ago, it is still only just above 4%. But my anecdotal experience (as the father of kids with degrees) is that a college degree is not the ticket it used to be. People with degrees are working more, but they are moving down the “food chain,” taking lower-paying jobs or jobs needing fewer skills than they were trained in. That is just the way it is.

I actually get that on a closer level. Let’s just say that middle son was not my scholar. He did not finish high school and had to deal with it being hard to get good jobs. This year, he woke up and decided that he does indeed need an education. He went back to online high school and recently finished, and proudly brought me his diploma. He is enrolling in the local community college. All of my kids are hard-working, but in today’s world it takes more than a willingness to work hard. At the lower age and education levels, the competition for what few jobs there are is fierce. See below.

How Do We “Fix” the Employment Problem?

This Thursday night, 90 minutes before NFL football kicks off, President Obama will give us his latest version of policies to deal with the high unemployment rate. I hope we will hear that he is going to tell federal regulators they have to delete two rules already on the books for every new one they write, but I will not hold my breath. More green jobs? Why not simply allow energy companies to drill? I could go on, but the real point is that whoever is in the White House, Democrat or Republican, will face an uphill battle.

Goldman Sachs recently released a series of graphs for its hedge-fund clients, talking about ways to play a possible recession, with all sorts of long-short plays, options, spreads, etc. But in that report is a gold mine of data, which they should put up on the web in some form as a public service (without the suggested trades, because of regulations). It is really one of the better data compilations I have seen in a long time.

We are going to look at one table from that report, which goes along with an e-letter I wrote about two years ago, talking about how difficult it would be to recover from the employment losses of the recession. If anything, the situation has gotten worse since I wrote the original piece, which even back then was decidedly not optimistic (he says in understatement).

This table shows the number of jobs we would need to create on a consecutive monthly basis to get back to a given level of the labor force as a percentage of population, starting at 64%. Remember the chart above that shows we are barely above 58% now.

Note that simply to reduce the unemployment rate to 8% over two years at the lowest participation rate of 64% would require 157,000 jobs a month. If those jobs started showing up, the number of people looking for jobs would increase, thus increasing the “official” unemployment rate. Most of the numbers of required new jobs are simply not possible, if history is any guide. (This is a politician’s nightmare. It will be years before they can take credit for something they didn’t do.)

Of the 36 numbers in the table, only 6 have historically ever been achieved, and then only in rousing economies. Certainly not in an economy that is at stall speed at best.

The simple fact is that net new jobs for the last 15 years came from business start-ups or rather small businesses, as I have documented in previous letters. Goldman Sachs notes that historically 90% of new jobs come from small businesses, with 75% coming from firms with less than 20 employees. Some of those become Google, but a lot of them are simply small, local services. But every job, if it is yours, is important.

What we need to do is to make it easier for businesses to start and find capital. Reduce the regulatory burden that small businesses face. When small local banks need 1.2 employees to deal with regulations and compliance for every 1 worker they have making loans (as reported in the WSJ this week), something is seriously wrong.

The sad fact of the matter is that we are in for a long, slow slog uphill on employment for most the remainder of this decade, until we work through the debt crisis and deal with the deficits, as I outlined in Endgame.
[Quick plug. Amazon recently named Endgame as on of the top ten books so far this year. I was pleased. And the reviews just keep getting better as the book becomes more relevant with the passing months. Sadly, much of what we are dealing with all over the world is what we wrote about last year. You should get a copy!

We are clearly not coming out of recession like we normally do. That is because what we just experienced was not a normal “business-cycle” recession, but a deleveraging/balance-sheet/debt-crisis recession. And the latter simply take at least 5-6 years to work through, after a country begins to deal with the problem, which we have not.

To repeat, even if somehow a Republican appeared in the White House tomorrow, there is no magic he (or she!) could bring with him/her to fix the unemployment problem. There are just some things the private sector will have to do for itself, and the sooner the government stops getting in the way, the sooner will get things fixed. But it will take a long time, no mater what. That is just the way things are.

Some Thoughts on Gold

The question I am asked the most is some variant on “What do you think about gold?” So, let me deal with that question here, as it has been a while.

First, I do not think of gold as an investment. It is insurance for me. I buy a rather fixed amount of gold nearly every month, no matter the price. I hope the price of gold goes down, because that means I get more coins in the mail to go into the vault. Yes, I take delivery of my gold, and it is near me if I need it.

My fondest dream is that I will give my gold coins to my great-great grandkids some 70-80 years from now, and they will be rather embarrassed that their “Papa John” bought all that much of that barbarous yellow metal instead of more biotech stocks. But as I live in the real world, I buy gold, even though I am optimistic we’ll get through this rough patch; because I simply don’t trust the bas*%*ds who are driving this ship with 100% of my money in dollars, or any fiat currency, for that matter.

Gold to me is a neutral currency. While the metal looks good over the last ten years (and I became bullish on it in 2002 in this letter), over the last 32 years it has not had all that much luster. Bonds have been much better as an investment. It is all about timing.

If I wanted to buy gold for investment or trading, I would simply buy GLD. (It is an excellent vehicle for traders; however, GLD is not what I think of as insurance.) And if I were buying gold as a trade, I would buy it in terms of the euro or yen, which I think are both going down against the US dollar.

For those who want to buy larger sums of gold, there is a program that I like backed/sponsored by the state government of Western Australia, called the Perth Mint. You can buy gold certificates that represent actual bullion in vaults in Perth at reasonable prices. While your gold is stored in Perth, you can take delivery if you want and leave the country with no taxes owed. Or you can sell the gold and get cash. You diversify your country risk, have excellent and safe storage facilities, diversify your currency risk (if, like me, you think of gold as a currency), and have a different asset class than traditional portfolios.

You can learn more about the Perth Mint. And one of their dealers is an old friend of mine, Mike Checkan of Asset Strategies International. I have known Mike for about 30 years, and he does what he says and shoots straight. He is well-known in the investment information world, with lots of endorsements. You can learn more about his outfit at or call them toll-free at (800) 831-0007 in the U.S. and Canada, or direct at (301) 881-8600. You can also email them from their web site.

Where to buy actual bullion? Gold coins are gold coins. ASI is a good choice, but I would shop around. Depending on the amount you are buying, mark-ups can be significant, and there are differences in service and responsiveness. Delivery can be an issue, although I get mine in the mail with insured mail (although we do have to pick it up!).

Do I think gold is at a high? While I hope so, I truly do, I rather think that gold still has some upside because of government policies. When the deficit gets under control and we are on the road to real recovery, I rather think that gold will come back down from whatever highs it makes. I remember in 1980 there were True Believers who thought gold could only go one way.

For the record, I think you should own about 5% of your net worth in gold, as insurance, not as an investment. The “goal” and your hope should be to never have a reason to sell your gold. I trust that tells you where I stand.

Europe, New York, Conferences, Etc.

I am home for another three weeks, and then yet another crazy period of travel begins. I am off to Malta, London, Dublin, and Geneva late September through October 5. The next week, on the 14th, I go to Houston for a conference (along with David Rosenberg, Ed Easterling and others; more information at here).

Then I fly to New York for the weekend, where I will be speaking at the Singularity Summit, which is October 15-16. This is an outstanding conference, and I am honored to be asked to speak. It is really a bunch of wild-eyed futurists (like your humble analyst) getting together to think about what the future holds for us. For two days, I get to be an optimist, if only in the longer term! Ray Kurzweil is the guiding light, and he has assembled an all-star cast. You can learn more at Singularity Summit. For those who can make it, I think you will come back amazed and more positive about the future of the world. And you can see videos of previous conference presentations at the web site. Well worth an evening or two or three, and the price is right; but if you can make the conference, you will enjoy the experience and meet new friends.

Next week I will be recording a video with longtime friends Doug Casey and David Galland on the American Debt Crisis. This is a little new to me, as I will be in my living room but on video. It will be available the following week for free to those who sign up here. It is interesting to be doing this, as I become the “optimist” in this discussion. Warning: these guys are hard-core libertarians, but they are lots of fun!

This weekend is Labor Day in the US, and the kids are coming to Dad’s, along with friends and friends of friends. I see grilled steaks and hamburgers, lots of side dishes and mushrooms! And lots of family fun. I really like (and live for) days like this! And I did my part for the US economy and got a new grill, although I was surprised at how much grill we got for the dollar.

It is time to hit the send button. Have a great weekend and week. And if you are working, be thankful. There are too many in the world who don’t have that privilege.

Your glad he has too much to do analyst,

John Mauldin

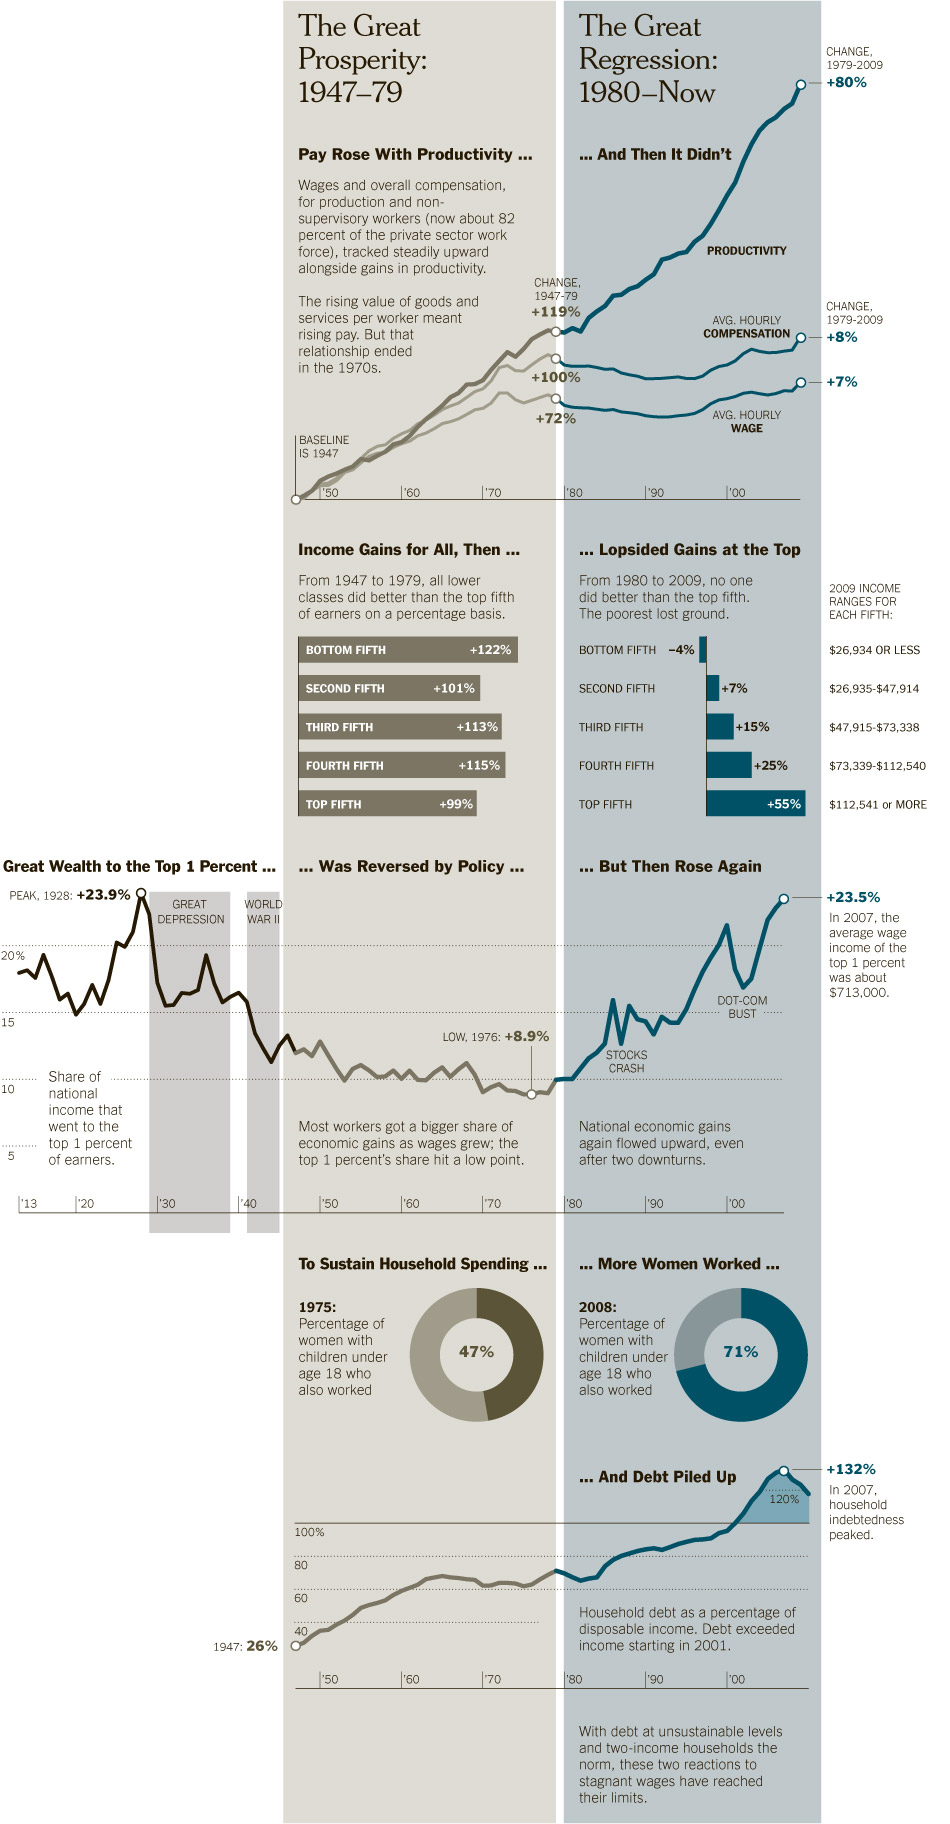
Great Prosperity (1947-77) vs. Great Regression (1981-?)

by NYT
>
click for ginormous version:

>

Stock Market Big Picture


What started off as a promising week for the equity markets ends mixed in the US: SPX/DOW -0.3%, and the NDX/NAZ +0.2%. In between, the market gapped up monday morning from friday’s SPX 1177 close. Then hit SPX 1231 on wednesday only to gap down friday ending the week at SPX 1174. Economic reports continued to be slanted to the downside. On the upswing: personal income/spending, PCE prices, the Case-Shiller index, factory orders, auto sales, the m1-multiplier, and jobless claims improved. On the downswing: pending home sales, construction spending the Chicago PMI, ISM manufacturing, the ADP index, monthly Payrolls, the monetary base, the WLEI, and consumer confidence plunged. Asian markets gained 1.9%, European markets gained 1.7%, the Commodity equity group gained 3.7%, and the DJ World index rose 1.6%. Next week we have the FED’s Beige book, ISM services, and Consumer credit.

BIG PICTURE: Secular bear cycle
Let’s look at the big picture, and put the process of getting there aside for the moment.


We last published this chart in this piece, which was more about cycles in humanity and politics than markets: http://caldaro.wordpress.com/2010/11/04/politics-and-secular-bullbear-markets/. The Saeculum turnings are described in the article. What is important now is the Secular bull/bear markets. Notice the two boxed areas are 18 year Secular bull markets. The next one is on the way, but we are not there yet. The three other time periods are with choppy sideways activity: 1929-1949 (excluding the GSC crash), 1967-1982 and 2000-2016(?). These are three Secular bear markets alternating between deflationary forces (1929) to inflationary forces (1967), and then back to deflation (2000). Wonder why Bond rates are so low? We’ve been in a deflationary environment for over a decade now.

The typical Secular bear cycle unfolds as follows. The cycle begins at a preliminary peak, i.e. 1967 and 2000. A bear market follows: i.e., the 1967-1970 Nifty 50 collapse and the 2000-2002 Nasdaq 100 collapse. The market then hits its primary peak approaching the midpoint of the cycle, (all time high), i.e. 1973 and 2007. A nasty bear market follows creating the actual price low of the cycle, i.e. 1973-1974 and 2007-2009. A short lived bull market then follows, i.e. 1974-1976 and 2009-2011. Finally the market enters another bear market to end the Secular bear cycle. We have entered that bear market now.

We omitted comparison to the 1929-1949 Secular bear cycle for two reasons. First, the collapse between 1929 and 1932 was on a Grand Supercycle scale. The market lost 89% of its value in just those three years. Events like that only come along about every 200 years. The 2007-2009 bear market, for example, was of a Supercycle degree as the market lost 58% of its value. It was certainly the largest bear market since 1929, but not of the same degree. The second reason was, the normal 16 year bear cycle was extended 4 years by World War II. However, even that bear cycle matched up with the 13 year commodity bull cycle.

Commodity bull markets only occur during equity bear Secular cycles. The three commodity bull Secular cycles: 1933-1946, 1967-1980 and 2001-2014(?). Notice how the previous equity bear cycles ended 2-3 years after the commodity bull market ended, i.e. 1949 and 1982. This is exactly what we will be looking for over the next few years to identify the beginning of the new equity 18 year secular bull market. One could conclude they should be invested in equities during its Secular bull market. Then wait a year or two and invest in commodites during their Secular bull market. A year or two later and it’s back to equities. What do you then do with all the spare time? Help others learn how to help themselves. In this world it is not what you get that’s important, it’s what you give.

LONG TERM: bear market highly probable

When we review the wave structure from the March 2009 SPX 667 low we can count a detailed Primary wave I, then simple Primary waves II – V. Since Primary wave IV (SPX 1249) did not overlap Primary wave I (SPX 1220) and Primary waves II and IV alternated in wave structure, we have a clear five wave bull market peaking at SPX 1371 in May 2011. The price activity since that high confirms that five waves did complete in May. Even the technicals have switched from bull market mode to bear market.


Notice how the weekly MACD remained above neutral during the last two bull markets, then broke into negative territory after the following bear markets began. Also notice during both bull markets the RSI never got extremely oversold. But it gets extremely oversold during the bear markets.

Last weekend we posted a chart displaying how oversold this market had become, even for a bear market, at the recent SPX 1102 low. We then assumed that SPX 1102 was a significant low, and the market would now enter a two month counter-trend rally retracing about 50% of the entire decline thus far. The decline SPX 1371 to 1102 was 269 points. Therefore a 50% retracement would carry the market to SPX 1237. Surprisingly, the market accomplished that task in only three weeks when it hit SPX 1231 this wednesday. Don’t be fooled, B wave rallies can often look like new bull markets.

MEDIUM TERM: downtrend low may have been SPX 1102

We expect the current, highly probable, bear market to unfold in three Primary waves ABC. The two legs down, A and C, can take the form of five waves down or three. The B wave will always be three waves up. After careful review of the technicals we had posted our preferred three wave down count on the SPX charts, and our alternate count of five waves down on the DOW charts. After this week’s activity we still feel the SPX count is the preferred count.


The market downtrended from SPX 1371 to 1258 in June, and we labeled that wave Major wave a. The uptrend that followed to SPX 1356 in July was labeled Major wave b. The next downtrend, from that high, we anticipated ended in August at SPX 1121 (orthodox low SPX 1102) and have labeled ‘tentatively’ Primary wave A (Major wave c). Until we get an OEW uptrend confirmation we can not be certain. We counted that decline as five waves down, just like Major wave a, but with a failed fifth wave.

After that low we observed an abc rally to SPX 1231 this wednesday, and then a decline to 1171 on friday. This decline confirmed its was an abc rally when it overlapped SPX 1191. This three wave rally we labeled Major wave a of Primary wave B. Since we have not had an uptrend confirmation yet there is also another possibility. SPX 1102 may have only ended Intermediate wave iii of Major wave c, and all the activity up to 1231 was Intermediate wave iv. We have added that count, in green, on the SPX charts. A decline below SPX 1121 would confirm that count, and a continuation of the downtrend.

Focusing on the preferred count. With a three month Primary wave A completed at SPX 1121. We should now observe an abA-B-abC two month Primary wave B. The recent rally to SPX 1231 fits the abA scenario and we labeled it Major wave A. The Major wave B pullback part should be underway now. Then, when it completes, we should get another abc rally to complete Major wave C and Primary wave B. This could occur this month, it’s still a fast market, or next. After Primary wave B completes we should start the next three wave (trend) structure down. We did some fibonacci work and this scenario aligns quite nicely with our two support zones for the bear market: SPX 1011 and SPX 869. When we get more market data we’ll post that information.

SHORT TERM

Support for the SPX is at 1168 and then 1146, with resistance at 1176 and then 1187. Short term momentum ended the week extremely oversold. The recent rally from SPX 1121, Primary A, took the form of an abc (1191-1136-1231). Wave c was 1.382 times wave a. The total rally was 110 points, and we labeled it Major A. Normal retracement levels for Major B are 50% (SPX 1176) and 61.8% (SPX 1163). On friday we hit right in between those two levels, which also represent the 1176 and 1168 pivots. With an extremely oversold short term condition there is a good chance the market will either bottom here, to complete Major B. Or, rally and then make a slightly lower low for a positive divergence low. Since the US market is closed on monday we’ll get a better idea after the foreign markets close.


The current decline can go all the way down to the OEW 1136 pivot, which was the previous Intermediate wave A decline and not change the potential Major wave B scenario. However, if that pivot’s range were to fail then the alternate Intermediate wave iv high at SPX 1231 would come into play, and the market would then be in Intermediate wave v of an ongoing downtrend. We’ll keep you posted, as usual, day by day as this market unfolds. Best to your trading!

FOREIGN MARKETS

The Asian markets were mostly higher for a net gain of 1.8%. No confirmed uptrends yet.

The European markets were mostly higher for a net gain of 1.7%. Again no confirmed uptrends yet.

The Commodity equity group were all higher for a net gain of 3.7%. No confirmed uptrends here either.

The DJ World index gained 1.6%.

COMMODITIES

Bonds rallied to new uptrend highs this week gaining 0.8%. The 10YR yield closed at 1.996%, and the 30YR is down to 3.31%.

Gold rallied again this week, +3.0%, with all of it on friday’s 3.2% rally. Silver and Gold are getting very close to extending their uptrends.

Crude gained 1.3% despite a 2.3% decline on friday. It remains trying to establish an uptrend.

The USD gained 1.3% on the week and is now uptrending. The EUR lost 2.0% on the week, and the JPY declined 0.6%. We’re looking for a major reversal in the currencies to be underway soon.

NEXT WEEK

A light economic calendar heading into the holdiay shortened week. On tuesday ISM services at 10:00. On wednesday the FED’s beige book, then on thursday weekly Jobless claims, the Trade deficit, and Consumer credit. Friday ends the week with Wholesale inventories. As for the FED. FED chairman Bernanke gives a speech on thursday, in Minn. on the US Economic Outlook. With two FED governors coming out this week for QE 3, this speech could be a market mover. Best to you and yours this holiday weekend!

See the original article >>

Follow Us