Saturday, July 16, 2011

Goldman Slashes Economic Forecast, Cuts Q3 GDP To 2.5%, Sees Q2 Below Stall Speed


Nobody could have foreseen this now typical Friday night bomb from the 200 West macroeconomic wrecking crew. Nobody. Well... "Here is the first official Q3 GDP downgrade, courtesy of JPM's Michael Feroli. We fully expect every other clueless Wall Street lemming to follow suit in minutes." But as long as the lemmings all move in a herd over the cliff, they will still somehow all get paid the same $5 million (of which 25% is cash and the rest is indentured cliff-vesting equity servitude) at the end of the year. Either way, can we all now agree that Goldman did indeed jump the shark in December, especially now that it sees Q1 GDP at below stall speed in real terms. So here it is: "Following another week of weak economic data, we have cut our estimates for real GDP growth in the second and third quarter of 2011 to 1.5% and 2.5%, respectively, from 2% and 3.25%. Our forecasts for Q4 and 2012 are under review, but even excluding any further changes we now expect the unemployment rate to come down only modestly to 8¾% at the end of 2012." Here is why Hatzius gets paid the big Bernankebux: "The “bugbear” is that we are still unsure about the precise reasons for the slowdown in 2011 to date, which is sharply at odds with our expectation at the end of last year that growth would accelerate in 2011." And the punchline: "Our forecast remains no fresh monetary easing from the Federal Reserve, but the probability has risen. In particular, Fed officials would undoubtedly ease if the economy returned to recession—not our forecast, but clearly a possibility given the recent numbers." Our prediction is that when Bill Dudley's 2011 calendar is released in December, his first meeting with Jan Hatzius at the Pound and Pence will have taken place right.... about.... now.


From GS:


More Downgrades to Our Growth Forecasts

  • Following another week of weak economic data, we have cut our estimates for real GDP growth in the second and third quarter of 2011 to 1.5% and 2.5%, respectively, from 2% and 3.25%. Our forecasts for Q4 and 2012 are under review, but even excluding any further changes we now expect the unemployment rate to come down only modestly to 8¾% at the end of 2012.
  • The main reason for the downgrade is that the high-frequency information on overall economic activity has continued to fall substantially short of our expectations. In particular, our “bean count” for second-quarter GDP has deteriorated further and our monthly Current Activity Indicator (CAI) is showing growth of just 1.3% in June.
  • Some of this weakness is undoubtedly related to temporary factors, namely supply chain disruptions and (the temporary part of) the oil shock. But the slowdown of recent months goes well beyond this. One major concern is the anemic growth in domestic final sales of just ½% (annualized) in the first half of 2011. There is only one precedent in the postwar period for such weak demand growth outside the immediate vicinity of a recession.
  • We have no hard information about final sales in Q3 yet, but Friday’s preliminary consumer sentiment index for July from the University of Michigan fell to the lowest level since March 2009 (!) and is now back in territory normally associated with recession.
  • Our forecast remains no fresh monetary easing from the Federal Reserve, but the probability has risen. In particular, Fed officials would undoubtedly ease if the economy returned to recession—not our forecast, but clearly a possibility given the recent numbers.

Following another week of weak economic data, we have cut our estimates for real GDP growth in the second and third quarter of 2011 to 1.5% and 2.5%, respectively, from 2% and 3.25%. Our forecasts for Q4 and 2012 are under review, but even excluding any further changes we now expect the unemployment rate to come down only modestly to 8¾% at the end of 2012.


The main reason for the downgrade is that the high-frequency information on overall economic activity has continued to fall substantially short of our expectations. In particular, our “bean count” for second-quarter GDP has deteriorated further and our monthly Current Activity Indicator (CAI)—a broader and higher-frequency measure that takes into account 25 different indicators of monthly and weekly activity—is showing growth of just 1.3% (annualized) in June, with a pattern of deceleration through the second quarter (see Exhibit 1).


Some of this weakness is undoubtedly related to the disruptions to the supply chain—specifically in the auto sector—following the East Japan earthquake. By our estimates, this disruption has subtracted around ½ percentage point from second-quarter GDP growth. We expect this hit to reverse fully in the next couple of months, and this could add ½ point to third-quarter GDP growth. Moreover, some of the hit from higher energy costs is probably also temporary, as crude prices are down on net over the past three months. But the slowdown of recent months goes well beyond what can be explained with these temporary effects.


One piece of fresh evidence comes from the New York Fed’s Empire State survey for July, which showed another sub-zero reading for both general business conditions and new orders (see Exhibit 2). And while the Empire State is still clearly in mid-cycle slowdown territory, final demand growth has slowed to a pace that is typically only seen in recessions. This is illustrated in Exhibit 3, which shows that real final sales to domestic purchasers—that is, real GDP excluding inventories and net exports—has grown at an estimated rate of only ½% (annualized) in the first half of 2011. There is only one precedent for such a weak demand growth pace outside the immediate vicinity of a recession.


One key question in coming months is whether final demand recovers to the 2%-2½% pace that is probably necessary to keep GDP growth near trend and prevent the unemployment rate from rising more noticeably. Obviously, we have no hard information about Q3 in this regard yet, but Friday’s preliminary consumer sentiment index for July from the University of Michigan was highly discouraging. The index fell to the lowest level since March 2009 (!) and is now back in territory normally associated with a contraction in real consumer spending and overall final demand (see Exhibit 4). Admittedly, consumer sentiment does not have much forward-looking value, and it is possible that the extensive media coverage of the negotiations around the federal debt ceiling has depressed sentiment. If so, agreement on this issue—which we believe may be coming closer—could lead to a rebound in sentiment. However, we would probably need to see a substantial improvement to undo the dramatic message of Exhibit 4, and to avert further downgrades to our GDP growth estimates in Q4 and 2012.


Unfortunately, our confidence in the growth forecast remains relatively low. The “bugbear” is that we are still unsure about the precise reasons for the slowdown in 2011 to date, which is sharply at odds with our expectation at the end of last year that growth would accelerate in 2011. Logically, the explanation presumably has to involve a combination of a) unforeseen shocks from the Japan earthquake and the oil market, coupled with b) more vulnerability to these shocks, because c) the housing and credit market downturn is weighing on private-sector balance sheets for even longer than we thought. But the relative importance of these issues is exceptionally difficult to sort out, and it makes a great deal of difference for the outlook.


The weaker data on economic activity have clearly raised the probability of renewed monetary easing by the Federal Reserve. In his monetary policy testimony this week, Chairman Bernanke’s main argument against renewed easing was that inflation is now significantly higher than it was in the summer of 2010. Indeed, the core CPI for June released on Friday showed a pickup in the 6-month annualized inflation rate to 2.5%, clearly above the “mandate-consistent” rate of 2% or a bit less. However, we may well have seen the highest inflation figures. Exhibit 5 shows that underneath the surface, both the “median” and “trimmed-mean” indexes—statistically based measures of underlying inflation that may be preferable to the better-known core CPI—showed a notable slowdown. Therefore, we still expect core inflation to slow substantially on a sequential basis over the next year.


Moreover, if the economy returns to recession—not our forecast, but clearly a possibility given the recent numbers—Fed officials would undoubtedly ease anew even if inflation is close to their target. Indeed, Chairman Bernanke laid out the possible options for such a move in his monetary policy testimony this week, namely a change in the forward-looking language in the FOMC statement, a cut in the interest rate on excess reserves, and—last but certainly not least—an increase in the size and/or composition of the Fed’s balance sheet.

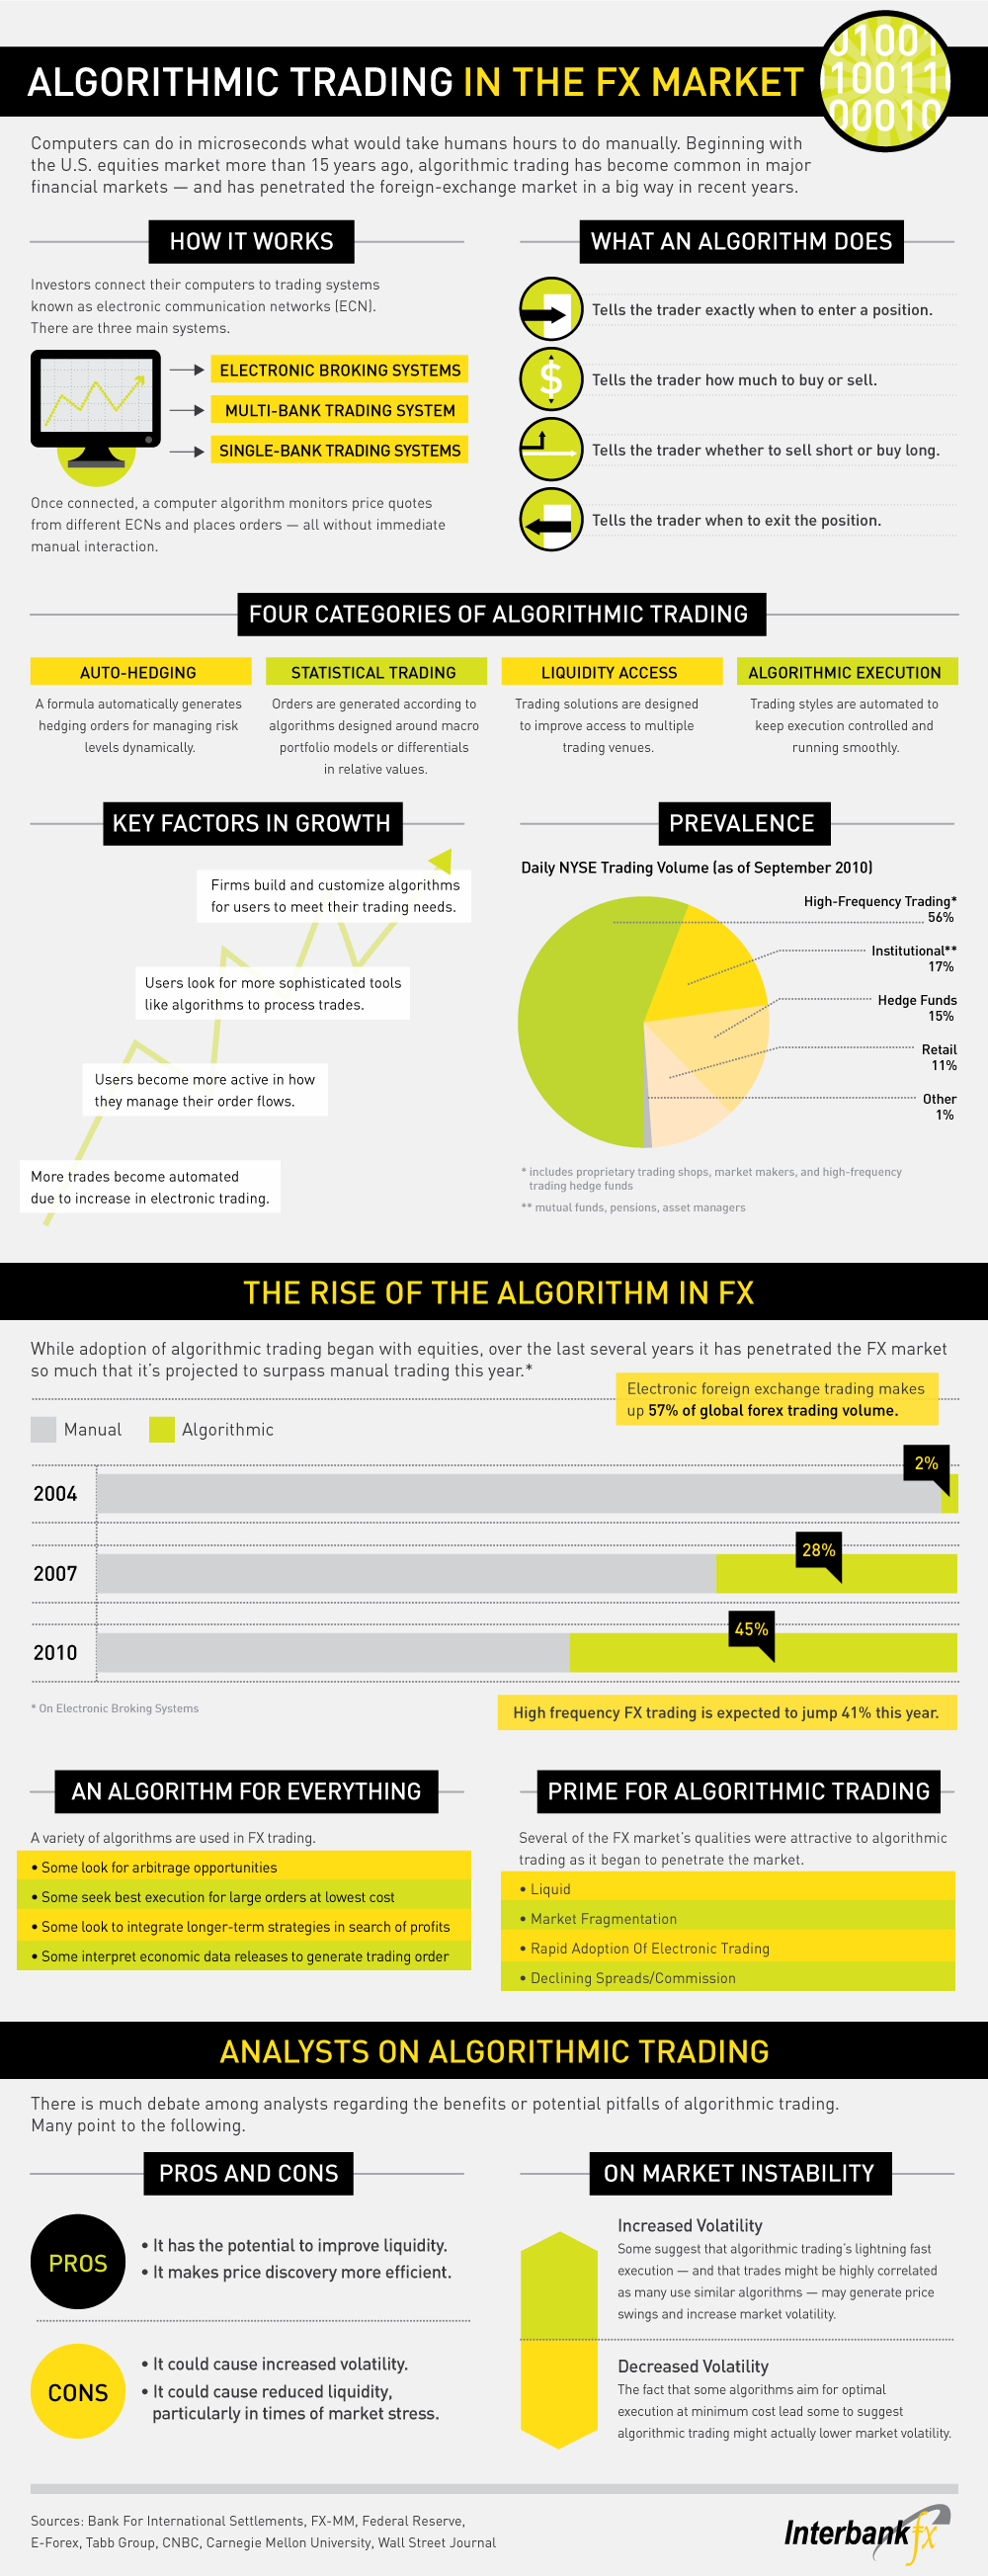
Rise of the Algorithm

click for ginormous graphic

Interbank FX, Rise of the Algorithm

Industrials could signal slower growth ahead


(Reuters) - U.S. manufacturers are entering an period where growth is more muted, profit margins are harder to raise and earnings beats are less common.

The easy money has been made, many analysts and shareholders of U.S. industrial stocks say.

General Electric Co's (GE.N) Jeff Immelt, whose company reports second-quarter earnings next week, acknowledges that the industrial conglomerate is operating in volatile times.

Demand is tremendous, the company's chief executive says. "You see it getting better, yet at the same time, there's more discontent," Immelt said this week at a sprawling GE factory in South Carolina. "This recovery has been so different from previous recoveries."

Analysts say industrials are in transition from a

"V-shaped" recovery after recession, when nearly everyone increased sales and profits, to an unpredictable period when some businesses thrive, others lag and picking winners is harder.

"Industrials as a group may be among the first to see their profit margins challenged," said Keith Goddard, manager of the Capital Advisors Growth Fund, which owns GE, Johnson Controls (JCI.N) and FedEx (FDX.N), among other companies whose fortunes are tied to the business cycle.

"Margins are bumping up against all-time highs," said Goddard, who favors healthcare stocks. "Don't go to the industrial space looking for positive earnings surprises."

Increasing commodity and labor costs will trim profits across corporate America, he said, hitting labor-intensive manufacturers. GE has more than 100,000 workers just in the United States.

Many investors play down the negative effects of the U.S. government debt-ceiling impasse and a cautious, debt-burdened U.S. consumer. Slow growth is not a double-dip recession, they say.

Although the U.S. recovery has stalled by some measures, other large economies are still hungry for heavy machinery, cooling equipment, tools and other industrial goods.

Companies keyed to Brazil, India and China, including 3M (MMM.N), Eaton Corp (ETN.N) and Emerson Electric Co (EMR.N), will again benefit from robust capital spending, much of it funded by governments.
One question earnings season may answer is whether Europe's debt crisis will affect growth and alter profit expectations. Europe's problems are overemphasized, said Oliver Pursche, co-manager of the GMG 
Defensive Beta Fund, which holds shares of Caterpillar (CAT.N), Deere (DE.N) and United Technologies (UTX.N).

Industrial shares have rallied into earnings season. For a graphic, click: r.reuters.com/wes62s

"I'm not too worried about earnings this quarter," Pursche said -- but a potential global economic slowdown could damp prospects for corporate profits. "I'm much more concerned about cautionary statements from CFOs and CEOs about the rest of the year. It's going to be a much more challenging environment."

Caterpillar could sound a cautious note because of China's efforts to rein in its economy, he said. China's leaders have suggested they will again raise interest rates and bank reserve requirements to bring down inflation.

STALLED RECOVERY

U.S. industrials are among the most globally diverse multinationals, but the U.S. market still accounts for as much as half of their revenue. Recent data offers fodder for both bulls and bears.

U.S. June industrial production data disappointed on Friday, and May was revised lower.

A monthly gauge of factory activity by the Institute of Supply Management rebounded last month from a May slump, easing fears of a broad slowdown.

But construction spending -- a key market for companies ranging from Eaton to Ingersoll Rand (IR.N), 
United Technologies and Tyco (TYC.N) -- has fallen for six straight months to its lowest in a decade.
And a quarterly Manufacturers Alliance/MAPI survey pointed to further growth, but at a slower rate. The poll of financial executives, a leading indicator of manufacturing activity, found a fourth straight decline in sentiment.

Companies whose fiscal years ended in June, including Parker Hannifin (PH.N) and Kennametal (KMT.N), will give initial glimpses into 2012 when they introduce 12-month earnings forecasts. Both are known for starting with conservative profit targets.

Other variables to watch this quarter are how much Japan's March earthquake hurts companies such as 3M; electrical manufacturers' ability to offset higher steel and copper costs with pricing; and the impact of a weak U.S. dollar.

Depressed housing and a delayed recovery in non-residential construction could hurt machinery makers and rental companies, as well as makers of air conditioners and components.

Other late-cycle markets, such as power generation equipment and aerospace, are also expected to grow over the next two years after declines in 2009 and 2010, so any sign of whether their rebound has begun will be an area of focus.

Electrical equipment and multi-industry companies are near the end of a beat-and-raise phase of their cycle, said Nomura analyst Shannon O'Callahan.

"You had the big V-shaped snapback against easy comparisons," he said. "Growth has been abnormally high. We're entering a maturing part of the cycle."

Managers will point to moderating growth rates this quarter, with few sounding especially bullish. Corporate crystal balls are as cloudy as anyone else's, O'Callahan said.
'WHITE-KNUCKLE' BULLS

Enough investors see the glass as half-full that earnings expectations and price-to-earnings ratios have risen this year. Industrial shares .GSPIC are up 7 percent year to date, outperforming the broader market. A few, such as Tyco and SPX (SPW.N), have jumped 25 percent or more.

At 16 times this year's estimated earnings, industrials are more richly valued than the overall S&P 500, but are only slightly above their historical average, according to Goldman Sachs.

Goldman analysts, in a July 10 note, predicted industrial companies would sound a more "constructive" tone about the second half of the year than recent economic numbers suggest. They cited expanding late-cycle markets, the weak dollar, and share buybacks and acquisitions.

Most U.S. industrials will beat Wall Street forecasts by 1 percent or 2 percent, said analyst Brian Langenberg of Langenberg & Co, who calls himself a "white-knuckle" bull.

"I expect bigger beats out of companies levered to energy," he said, citing Dover (DOV.N), Ametek (AME.N) and Emerson. "Ninety-some-dollar oil makes it worth punching holes in the ground."

Langenberg said current expectations of double-digit profit growth over the next two years are reasonable.
"We're not back at peak earnings yet," he said.

See the original article >>

Green Bootleggers and Baptists


In May, the United Nations’ International Panel on Climate Change made media waves with a new report on renewable energy. As in the past, the IPCC first issued a short summary; only later would it reveal all of the data. So it was left up to the IPCC’s spin-doctors to present the take-home message for journalists.
The first line of the IPCC’s press release declared, “Close to 80% of the world‘s energy supply could be met by renewables by mid-century if backed by the right enabling public policies.” That story was repeated by media organizations worldwide.

Last month, the IPCC released the full report, together with the data behind this startlingly optimistic claim. Only then did it emerge that it was based solely on the most optimistic of 164 modeling scenarios that researchers investigated. And this single scenario stemmed from a single study that was traced back to a report by the environmental organization Greenpeace. The author of that report – a Greenpeace staff member – was one of the IPCC’s lead authors.

The claim rested on the assumption of a large reduction in global energy use. Given the number of people climbing out of poverty in China and India, that is a deeply implausible scenario.

When the IPCC first made the claim, global-warming activists and renewable-energy companies cheered. “The report clearly demonstrates that renewable technologies could supply the world with more energy than it would ever need,” boasted Steve Sawyer, Secretary-General of the Global Wind Energy Council.

This sort of behavior – with activists and big energy companies uniting to applaud anything that suggests a need for increased subsidies to alternative energy – was famously captured by the so-called “bootleggers and Baptists” theory of politics.

The theory grew out of the experience of the southern United States, where many jurisdictions required stores to close on Sunday, thus preventing the sale of alcohol. The regulation was supported by religious groups for moral reasons, but also by bootleggers, because they had the market to themselves on Sundays. Politicians would adopt the Baptists’ pious rhetoric, while quietly taking campaign contributions from the criminals.

Of course, today’s climate-change “bootleggers” are not engaged in any illegal behavior. But the self-interest of energy companies, biofuel producers, insurance firms, lobbyists, and others in supporting “green” policies is a point that is often missed.

Indeed, the “bootleggers and Baptists” theory helps to account for other developments in global warming policy over the past decade or so. For example, the Kyoto Protocol would have cost trillions of dollars, but would have achieved a practically indiscernible difference in stemming the rise in global temperature. Yet activists claimed that there was a moral obligation to cut carbon-dioxide emissions, and were cheered on by businesses that stood to gain.

During the ill-fated Copenhagen climate summit in December 2009, Denmark’s capital city was plastered with slick ads urging the delegates to make a strong deal –paid for by Vestas, the world’s largest windmill producer.

Oil tycoon T. Boone Pickens, a famous convert to environmentalism, drafted a “plan” (which he named after himself) to increase America’s reliance on renewables. Of course, he would also have been one of the major investors in the wind-power and natural-gas companies that would benefit from government subsidies.

Traditional energy giants like BP and Shell have championed their “green” credentials, while standing to profit from selling oil or gas instead of environmentally “unfriendly” coal. Even US electricity giant Duke Energy, a major coal consumer, won green kudos for promoting a US cap-and-trade scheme. But the firm ended up opposing the draft legislation to create such a scheme, because it did not provide sufficient free carbon-emission permits for coal companies.

Dubious claims by faithful activists gave rise to the biofuels industry (with supporting lobbyists). Biofuel production likely increases atmospheric carbon, owing to the massive deforestation that it requires, while crop diversion increases food prices and contributes to global hunger. While environmentalists have started to acknowledge this, the industry received a lot of activist support when it began – and neither agribusiness nor green-energy producers have any interest in changing course now.

Obviously, private firms are motivated by self-interest, and that is not necessarily a bad thing. But, too often, we hear commentators suggest that when Greenpeace and Big Business agree on something, it must be a sensible option. Business support for expensive policies such as the Kyoto Protocol – which would have done very little for climate change – indicate otherwise.

The climate-change “Baptists” provide the moral cover that politicians can use to sell regulation, along with scary stories that the media can use to attract readers or viewers. Businesses see opportunities for taxpayer-funded subsidies, and to pass on inevitable cost growth to consumers.

Unfortunately, this convergence of interests can push us to focus on ineffective, expensive responses to climate change. Whenever opposite political forces attract, as activists and big business have in the case of global warming, there is a high risk that the public interest will be caught in the middle.

Bjørn Lomborg is the author of The Skeptical Environmentalist and Cool It, head of the Copenhagen Consensus Center, and adjunct professor at Copenhagen Business School.

Jim Rogers: Buying Commodities Now Guarantees Success for Investors

By. David Moenning

Jim Rogers says the investing game is simple these days. Rogers said this week, “I do believe I could count on one hand the number of times I’ve been presented with an investment opportunity that guarantees success no matter what direction the economy takes.” Rogers adds, “If the world economy gets better, I earn my money on commodities. If the global economy gets worse, then they will print more money and I will make money in commodities.”

Although we have featured comments by Rogers many times on the site, Jim Rogers, who ran money with Mr. George Soros way back when, is one of the few investors with an investment record that substantiates his expertise and provides answers supported by both the fundamentals as well as detailed research.
Put simply, according to Jim Rogers, CEO and Chairman of Rogers Holdings, we should invest in commodities.

Despite last Friday’s employment report only serving to emphasize the fragility of the current economic recovery, Rogers confidently told CNBC that regardless of market highs or lows, he intends to invest, and successfully I might add, in commodities. He asserted that we are in the throes of a lasting bull market largely determined by supply limitations and demand growth from emerging markets.

And for quite some time, this strategy has suited him well. Since the year that the successful investor founded the Rogers International Commodity Index, Rogers has been bullish on commodities, up 340% since 1998.
If one were to assess the Index, he might notice that 35% is weighted to oil.

To better understand the reasoning behind this heavy favoring of the commodity, Rogers wrote in his book, 
Hot Commodities, “No major oil field has been discovered in the world for more than 35 years… We spend more money looking every year and have far superior technology available than we did a few decades ago. 
Yet we haven’t found another super giant oil field despite decades of trying. The easy, cheap stuff was found long ago.”

Despite global market instability, Rogers stressed simplicity in his approach.

He is long commodities and owns multiple currencies; short long-dated American Treasuries and technology. He has one major domestic bank and invests in emerging markets.

Rogers’ short positions are in place as cushions if the global economy deteriorates.

Additionally, he believes the Federal Reserve and other central banks will continue to print cash, further shielding his investments.

Long Term Haurlan Index Divergence


The Long Term Haurlan Index is showing a big divergence now, similar to ones that we have seen at past instances of impending stock market turmoil. That is the important part of the story in this week's chart. 

But the history of this indicator and its creator is also a really interesting story. The Haurlan Index is now a little known indicator used by a handful of technicians, but when it was introduced in the 1960s it got a lot of attention. It arguably still deserves that same amount of attention, even though we now have many more tools we can choose among.

P.N. (Pete) Haurlan was an actual rocket scientist who worked for the Jet Propulsion Laboratory in Pasadena, CA in the early 1960s. Haurlan served as manager of the Advanced Technical Studies section under Fred Felberg, and helped envision several future missions including Venus/Mercury, Jupiter Gravity-Assist, and near-asteroid visits.
Long Term Haurlan Index

He also loved the stock market, and so during the late night hours when JPL's computer was not busy, he used it to do analysis on stock prices. Try to imagine punching in price data onto a stock of IBM cards (remember hanging chads?), and then loading those into the hopper to have the computer read them and do calculations. This was the state of the art for computerized technical analysis in the 1960s.

Haurlan's work led him to start the Trade Levels newsletter in the mid-1960s. It differed from the other newsletters of the day in that it had computer generated charts and statistics. Trade Levels was the sponsor of Gene Morgan's end of day TV program called "Charting The Market" on KWHY-TV in Los Angeles, a show which introduced thousands of people to the idea that a person could look at a chart of price movements, and derive useful information from it. That idea ran contrary to the conventional wisdom at that time. 

Haurlan was also the first person (to our knowledge) to introduce the use of exponential moving averages for tracking stock prices. It was a piece of mathematics which he borrowed from his work in rocketry. EMAs were employed in the design of analog tracking circuitry because they made for easier designs. To calculate a 50-day simple moving average, for example, one must keep track of the last 50 data points, which was a lot of work for the early computers. For an exponential moving average calculation, the computer just needs to know the current data value, the prior EMA value, and the smoothing constant to apply to the new data.


In his Trade Levels Report, Haurlan included an indicator he called the Haurlan Index. There were actually 3 versions of this indicator, for short, intermediate, and long term timing purposes. Each one looked at the daily Advance-Decline (A-D) difference, and used different smoothing factors to incorporate that data into an indicator. 

From a 1972 issue of the Trade Levels report, Pete Haurlan defined the Haurlan Index as follows:

HI = K x (P - I)

Where I = previous day's Haurlan Index
P = NYSE Advances minus Declines
K = 50% for Short Term
10% for Intermediate Term
1% for Long Term

So each day's value for the Haurlan Index changes by a fraction of the difference between the A-D number and yesterday's Haurlan Index value.

The chart at the top of this article shows the Long Term Haurlan Index, which uses the 1% smoothing factor. It should be understood that the math involved is similar to the calculation of an exponential moving average, but it is not quite the same. 

In preparing this article, I ran into an interesting discovery. We keep exponential moving averages for several indicators, including the cumulative Advance-Decline Line shown below with its 1% Trend (199-day EMA). And so I wanted to see what the similarities were between the Long Term Haurlan Index, which does 1% smoothing on the daily A-D difference, and the 1% Trend of the A-D Line which is calculated on the values of the cumulative A-D Line.

NYSE A-D Line

The 1% Trend is a nice long term moving average for the A-D Line, and for price indices as well. One additional tool that we like to look at is the distance between the A-D Line and the 1% Trend, or indeed any other moving average. We call this distance the "1% Trend Deviation", meaning how far prices have deviated away from that moving average. 

The chart below shows the 1% Trend Deviation for the NYSE A-D Line. For comparison, it also shows the same Long Term Haurlan Index shown above.

Long Term Haurlan Index versus 1% Trend Deviation

This is the interesting discovery: It turns out that the two indicators are nearly identical. On a chart, they are indistinguishable, and in the calculations the two are very close together, if we apply a multiplication factor of 100. This is part of the magic of the math involved with calculations involving exponential moving averages.

The Key Takeaway

While the NYSE's A-D Line is still making higher highs right now, the Long Term Haurlan Index is showing a significant divergence relative to prices. This is similar to divergences we are seeing elsewhere, such as in the McClellan A-D Summation Index that is featured in our twice monthly newsletter. These divergences are saying that even though the A-D Line may be making higher highs, it is not doing so with the same degree of vigor, which can be a setup for a meaningful intermediate to long-term correction.


Epilogue

Pete Haurlan passed away in the late 1970s, and for several years the Trade Levels Report was continued by the late David Holt, who later went on to be research chief at Wedbush Morgan. It says something interesting about the era that in a February 1980 issue, the authors still included this caveat:

"Data has been prepared largely by computer. Because of schedule requirements and the magnitude of the task, it is not possible to check thoroughly. Therefore, there may be errors and omissions."

These days, we do not think much about the idea that a few decades ago, there was far less trust of data that came out of a computer, without any human eyes making sure it was all okay. Times surely have changed. 
The computer data may or may not be any more accurate now than it was in 1980, but we are all more accustomed to the idea of consuming such data.

Paul Carroll wrote about the 3 versions of the Haurlan Index in an article which appeared in the January 1994 issue of Technical Analysis of Stocks and Commodities.

Follow Us