Wednesday, June 29, 2011

Near-term Bottom for S&P500?

By: Mike_Paulenoff

Heading into the final hour of trading, the e-mini S&P 500 is pushing up against critical, final key resistance at 1293.75. If this level is hurdled and sustained, concurrent with a climb in the cash SPX above 1298.61, that would argue strongly that a significant near-term bottom has been established that also coincides with the bottom of my 70-75-day and 20-25 trading day cycles.

Should such a coincident signal occur today, it will be wise to exit short ETFs and look for a pullback in the S&P 500 Depository Receipts (SPY) to reposition the long side into the first hours or days of the ascendent portion of the new "up-cycle" convergence.

Admittedly, it is just a touch unnerving that the e-SPU has climbed to 1291.75 from yesterday's low at 1257 (+2.8%) right in front of the Greek vote. That said, regardless of the reasons or counter-intuitive circumstances that accompany cycle lows, the discipline calls for following the work when the signals unfold. It appears evident that such a situation is knocking at the door as we speak.


The Charts You Need to See Today

by Graham Summers

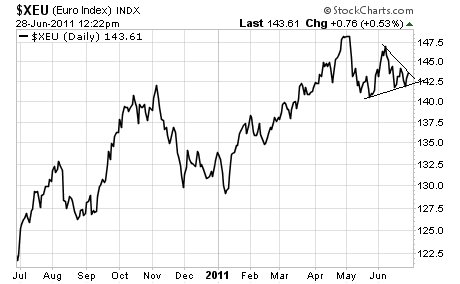
First up is the Euro which has the makings of a triangle pattern. These patterns can break to either the upside or the downside… although it’s hard to find reasons the Euro might rally if Greece accepts the next round of austerity measures since most of its resilience has been based on hype and hope of this already.

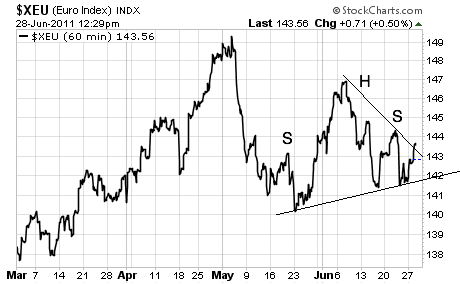
Indeed, we also see the makings of a Head and Shoulders pattern on the 60-minute chart for the Euro (I’ve also kept the triangle lines in place).

A very common bearish pattern, the H&S here forecasts a downward target of 135-136 or so. Of course neither the triangle nor H&S has been broken yet, so it’s too early to make a move here.

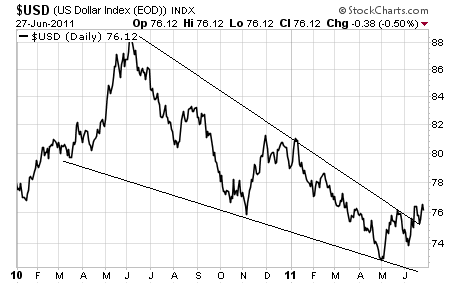
If the Euro does fall, expect the US Dollar to rally based on its index weighting to the former currency. Indeed, we see the potential for a serious US Dollar rally in the form of a bullish falling wedge pattern that may just have broken out to the upside:

The target for this pattern would be north of 80… possibly even 84-86. However, the only thing that could trigger that kind of a run in the greenback would be a MAJOR Euro Crisis.

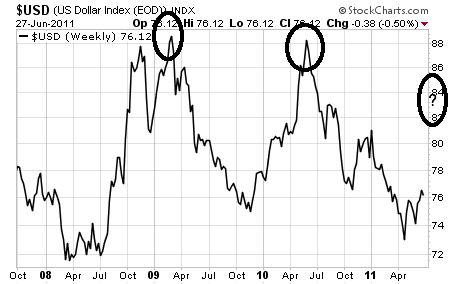
Since 2007, all major rallies in the US Dollar have been the result of stuff hitting the proverbial fan (the US has most certainly not implemented any fiscal moves that would strengthen our currency from a fundamental standpoint).

So, if and this is a BIG IF the US Dollar starts another bull run courtesy of a Euro collapse, we’ll likely see it peak out in the 84-86 range.

Should this happen, both stocks and commodities would take a sizable hit. However, of the lot Gold would come back the quickest. During the 2008 Crisis, Gold bottomed out in November 2008, a full four months before the US Dollar peaked. And the Euro Crisis of 2010 barely even dented Gold’s upward momentum:

To conclude, the charts today appear to be emphasizing the threat of deflation courtesy of a Euro collapse rather than inflation. And while it’s too early to invest based on these patterns (most of the patterns have yet to break-out), we’re getting close to finding the most prevalent trends for the coming months. We’ll have a much better idea once we see the results of Greece’s austerity vote.

Markets Catch Traders Offside

By Global Macro Monitor

Looks like traders, including yours truly, were caught catawampus in a pair of Nike shorts (ouch!), either not long enough or short, both equities and the Euro, coming into the week, even as some of the short-term signals were turning positive: 1) the commodity sell-off as a positive for margins and consumer purchasing power; 2) the French proposal to rollover some Greek debt, though we believe is weak and full of holes, the policymakers are at least moving in the right direction and Sarkozy is one of the few global politicos showing leadership; 3) the Asian markets, most notably, the Shanghai, have stabilized; 4) the S&P500 was able to make a higher high and higher low last week.

The S&P500 close today above the June 21 close of 1295.52, though on low volume, will now make traders think twice that this is only a bounce or just Q-end window dressing. They may try and sell it down tomorrow as the perception of a quarter-end tape painting bid subsides. This will be the test and a bounce and trade above the short-term intraday high of 1298.61 could bring in enough firepower to take the S&P up to the 50-day moving average, which is around 1317, into earnings season.

The way the equity market is trading we have a sense, for what it’s worth, the market is sold out – that is, very few sellers x/traders getting short – and is becoming immune to Greek tear gas and other macro swans, at least short-term. Bears need a new catalyst to take the market lower, which could come if earnings disappoint. Until then, we’re taking the over.

Wall Street is a very powerful industry and doesn’t get paid if markets trade “slide-ways” and that is one reality bears must live with. The negative events that could spoil this short-term scenario is the obvious rejection of the Greece austerity package, Euro debt contagion, and/or disorderly sell-off in Treasuries as QE2 goes into drydock. These are not low impact events and need to be closely monitored, especially after the weak Treasury auctions of the past few days.

The first stage of any equity rebound, however, should coincide with a bond sell-off as without the Fed’s QE2 purchases or robust credit expansion, the markets have now become a zero-sum allocation game. We don’t know for certain where the market is headed, but we’ve mapped the bullish case for the next few weeks and are now watching to see if they follow. Stay tuned!

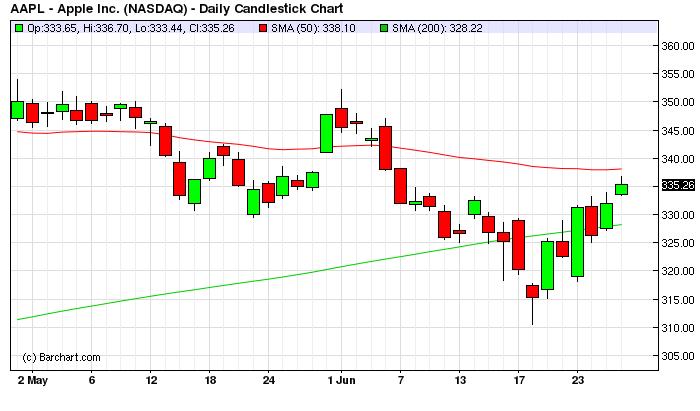
P.S. Apple is leading the market rally and came within $1.40 of recapturing its 50-day moving average.

See the original article >>

The Artificial Recovery

By David Rosenberg

Indeed, this 2009-2011 recovery and cyclical bull market has been as artificial as the 2003-07 expansion. That last one was fuelled by financial engineering in the financial sector. This one is being underpinned by unprecedented government intrusion in the credit markets. As of this quarter, your government has replaced the private sector as the largest source of outstanding mortgage market and consumer-related credit (see front page of the Investor’s Business Daily). So not only is the U.S.A. turning Japanese in many respects, it is also now resembling China where the government also redirects the flow of private sector credit.

When we said capitalism went on a sabbatical three years ago, we didn’t expect this to be a permanent vacation. In the past five years, private sector loans have deflated by $1.9 trillion, while public sector assisted credit has surged a similar amount. Roughly nine in 10 dollars of mortgage flow is being dominated by the Federal government — Fannie Mae, Ginnie Mae, Freddie Mac, and the FHA. That is amazing, and these entities have actually been tightening their scorecards to avoid political taxpayer backlash.

Be that as it may, in this new era of socialized credit, the private sector now accounts for 42% of outstanding residential mortgages, down from nearly 60% at the bubble peak in 2006. The only reason why consumer credit has not shown a complete implosion is because in the past three years, federally- assisted student loans have soared by $250 billion.

But not even the government can prevent credit from retrenching — the best it can do is cushion the blow. The front page of the weekend WSJ runs with an article on the aftershocks of the credit collapse — Tighter Lending Crimps Housing. Credit applications are still being rejected at a rapid rate.

About 20% of new home loan applications have been refused this year, up from 18% in 2010; 27% of refinancing requests have been turned down, up from 24%. And if you need any proof as to how this is playing out in the consumer space, have a look at Property Investors Face Losing Their Shirts with Strip Malls on page C14 of the WSJ. The low-income consumer that tends to shop at strip centers has been completely hobbled by weak job market conditions and punishingly high food and gas prices this cycle. Somehow the benefits from QE1 and QE2 bypassed the $50,000 and lower income club, and this group represents half of the U.S. consumer spending pie, for all the talk of Coach, Tiffany’s, and Saks for much of the past 24 months.

The WSJ emphasizes the implications of the on-going deleveraging cycle on the front page of today’s paper — Debit Hamstrings Recovery. It is so obvious that as much as the government tries to slow the process, it cannot prevent the private sector from healing itself after decades of tremendous credit excess. U.S.
consumers have 30% more credit card and other revolving debt on their balance sheet than they did just a decade ago. While outstandings are down 6% from the peak, there is still considerable contractions to go before household debt levels revert to the mean relative to both income and assets. At the same time, an estimated 23% of mortgages are “underwater” and it is against this backdrop that home-equity and credit lines have almost completely dried up. The necessity of climbing out from under this unprecedented amount of debt-related stress means that interest rates are very likely going to remain near the floor for a very long time. Ben Bernanke may publicly state that “extended period” means over the next few FOMC meetings, but anyone with a sense of history knows that they will stay close to zero for years to come.

And whoever thought we’d be seeing headlines like this, four years after the initial detonation in the U.S. housing market — Lennar Profit Slides 65% on page B8 of the weekend WSJ. Incredible. Revenues are down 6.1% YoY, margins are still compressing and order books are flat.

Random Views on U.S. Default

by Menzie Chinn

Mark Zandi, chief economist of Moody’s Analytics, said the market impact of failing to raise the $14.29 trillion debt ceiling by Aug. 2 could become severe by late July.

At a breakfast hosted by the Christian Science Monitor, here’s how Mr. Zandi told reporters things could play out.

“I think if we get on the other side of July, particularly as we move to the second and third week of July and nothing is happening, if the world looks like it is today, I think people are going to start getting nervous one investor at a time. And it’s going to start showing up in rising bond yields, a weakening equity market. Then all of the sudden we’re going to get to a day when we’re going to get a critical mass of investors saying, ‘You know what, this may not happen, we better attach a probability to an Aug. 2 misstep.’ And markets are going to start going south. And of course the rating agencies are going to start responding too…so if, we get to the end of July, I think the policy makers will see it quite clearly.”

He said if the ceiling isn’t raised by Aug. 2, “it’s going to be a TARP moment,” referring to the day in late 2008 when the House of Representatives voted down the creation of the $700 billion Troubled Asset Relief Program and stock markets plummeted.

And then what?
“The dark scenario is so dark I can’t imagine it,” he said.
As Republican leaders indicate tax revenues are off the table, so that all deficit reductions have to be derived from spending cuts EK, this scenario seems ever more plausible.

I think the TARP analogy is particularly apt. Just to remind readers, here is an excerpt from Lost Decades, coming out in September:

By the end of the day of the vote, the Dow Jones had
214 dropped over 770 points, its largest ever one-day drop in points — wiping out about $1.2 trillion dollars worth of stock value. … The TED spread [which] was hovering around 1 percent … rocketed above 3 percent, and it kept going, to an unprecedented
maximum of 3.87 percent. …”
Here’s a graphical depiction of the drop in equity prices.

default1 economy Figure 1: Dow Jones Industrial Averages, 9/15/2008-10/20/2008. Source: St. Louis Fed FREDII.


I thought it is of interest to see what the Kauffman survey of bloggers thought should be done, with respect to the debt ceiling.

default2 economy
Figure 2: from Kauffman Economic Outlook: A Quarterly Survey of Leading Economics Bloggers, Second Quarter 2011


In any case, I agree with Jim, for the sake of the country, the debt ceiling is the wrong place to draw a line in the sand. Saying that all deficit reduction must come from spending reductions, and none from tax revenue increases is the heighth of irresponsibility. (Others agree, even if even the default is “small” — see here. Some estimates of the impact on spreads here).

Cracks Beneath: China, Greece, US and Derivatives

by EconMatters

Greece has a population of just over 11 million people. Compare that to the New York City metropolitan area population estimated at 18.9 million. It may seem strange that Greece’s travails might greatly affect the global economy, but the potential repercussions from a Greek default become more significant when considering leverage and derivatives.


chart european banks economy
CNNMoney noted that data from the International Monetary Fund (IMF) show that German banks are heavily leveraged, holding 32 Euros of loans for every Euro of capital they have on hand. Other banks are leveraged to the hilt as well. Belgian banks are leveraged 30-1, and French banks are leveraged 26-1. Lehman’s leverage at the time of its collapse was 31-1. 
U.S. Banks are paragons of sanity by comparison, with an average leverage of only 13-1. France and Germany are the countries most exposed to Greek debt through bank and private lending and government debt exposure (Charts at Right & Below).


Picture4 economy
Derivatives present another potential minefield. As Louise Story wrote in the NY Times (Chart Below Added by EconMatters), ??
??“It’s the $616 billion question: Does the euro crisis have a hidden A.I.G.? No one seems to be sure, in large part because the world of derivatives is so murky. But the possibility that some company out there may have insured billions of dollars of European debt has added a new tension to the sovereign default debate…” ???
20110623 biz SWAPS graphic articleInline v3 economy
Chart Source: NYTime.com
?
“The looming uncertainties are whether these contracts — which insure against possibilities like a Greek default — are concentrated in the hands of a few companies, and if these companies will be able to pay out billions of dollars to cover losses during a default.”
Michael Hudson explored the differences between what happened to Iceland and its debt crisis, and what is currently happening in Greece.
“The bankers are trying to get a windfall by using the debt hammer to achieve what warfare did in times past. They are demanding privatization of public assets (on credit, with tax deductibility for interest so as to leave more cash flow to pay the bankers). This transfer of land, public utilities and interest as financial booty and tribute to creditor economies is what makes financial austerity like war in its effect…
“One must conclude that the EU’s new central planners…. are acting as class warriors by demanding that all losses are to be suffered by economies imposing debt deflation and permitting creditors to grab assets – as if this won’t make the problem worse. This ECB hard line is backed by U.S. Treasury Secretary Geithner, evidently so that U.S. institutions not lose their bets on derivative plays they have written up…”
In an interesting article, Brian Edmonds wonders whether the U.S. is too big to fail, linking the debt crisis in Greek to U.S. Money market funds holding large quantities of European debt.
“If Greece defaults, who will be holding the bag?… Recent publications have pointed, as one example, to the exposure of big U.S. money market funds that hold large amounts of short-term European bank debt.
“The biggest way that the risk of default is mitigated is through credit default swaps…. Sovereign debt swaps are the gorillas in the PIIGS room, but no one really knows if they are just 800-pound gorillas (large but manageable) or King Kongs (think AIG)….Only if, or when, Greece defaults will we know who ultimately has sold insurance against that default.”
China has now become Europe’s de facto IMF and World Bank. On Thursday, June 23, Qu Xing, director of the China Institute of International Studies, a Foreign Ministry think tank, told reporters that China doesn’t want to see debt restructuring in the Eurozone and is working with the IMF and countries involved with the debt crisis to avoid it. 

China has so far sunk about $50 billion in bad money, and Wen Jiabao is now in the market for Hungarian bonds. Speaking at a press conference during a visit to Hungary, Premier Wen Jiabao said,
“China is a long-term investor in Europe’s sovereign debt market. In recent years we have increased by a quite big margin holdings of Euro bonds. In the future, as we have done in the past, we will support Europe and the Euro.”
Sunday, on a tour of the Chinese-owned Longbridge MG Motor factory in Birmingham, Premier Wen told BBC it will lend to European countries, and also has plans to stimulate domestic demand and reduce its foreign trade surplus. Bailing out Europe is probably more of a priority for China than for the IMF.

We will see how China is going to juggle rescuing debt ridden Europe, battling rampant inflation, and the CNY10.7 trillion ($1.65 trillion) debt amassed by China’s local goverments.

Meanwhile, the U.S. Dollar bounced off of a high of 76.3 on Friday, June 24, and settled at 76.1, reminding us that our levels are more like trampolines than like walls. We currently believe the Dollar is apt to go down this week, which should be bullish for the markets. 

However, we are cashy and cautious again. Based on the premise that oil may be strong into the July 4 weekend, and the dollar may be weak, Phil Davis suggested a trade idea for going long USO:

This week $35/36 bull call spread is $0.61 and you can sell July $34 puts for $0.48 so that is a net $0.13 on the $1 spread. If USO makes it to $36 and holds it to next Friday, this can turn $650 cash into $5,000 (USO is now $35.83 with oil at $91.11).

Follow Us