Thursday, May 26, 2011

Energy Inventories Come in Greater Than Expected

by Bespoke Investment Group

This morning's weekly release of Energy inventories showed greater than expected builds across the board for crude oil, distillates, and gasoline. In the charts below, we show the weekly changes in crude oil and gasoline stockpiles so far in 2011 and compare those changes to the historical averages.

As shown in the charts below, crude oil stockpiles remain above average for this time of year. Additionally, this week's build in stockpiles contrasts to the average pattern where crude oil stockpiles typically begin to decline by this point of the year.

For gasoline, inventories rose but still remain below average for this time of year. Interestingly, gasoline has followed the pattern of the historical trend except that the magnitude of the moves this year has been greater. Earlier in the year, gasoline stockpiles were well above average, but then within a matter of weeks stockpiles quickly declined to below average levels.


Flight into Gold on Rampant Inflation and the Collapsing Dollar System


We believe that for the past 2-1/2 years the price of gold has been mainly driven by a flight to quality, as gold vied with the dollar for supremacy, as the world’s reserve currency. As we have witnessed gold has won that battle. The only way the dollar or any other world reserve currency can compete is by being backed 25% by gold. The elitist’s royalty of Wall Street and the City of London are quite upset with these developments, because they want all currencies to be fiat, so that they would not have to have a gold backed international monetary unit.

Over the last six months another historic factor has come into play in evaluating gold versus currencies, and that is the interconnectivity of gold’s relationship with inflation. In the late 1970s this was the underlying factor for the rise in the prices of both gold and silver. At that time they never had the luxury of strength also coming from recognition of being monetary units. We hear the manic claims that gold and silver are bubbles or are manias. That cannot be because gold is and always has been the only real money. Every time the major media makes these bogus claims they always fail to mention that both gold and silver have appreciated in value in excess of 20% annually versus nine major currencies. They refuse to point out gold and silvers’ 11 years track record having risen from $260.00 and $3.80 respectively to more than $1,500 and $50 per ounce. This shows you the massive deception by the major media, which is totally controlled by the elitists from behind the scenes.

When QE3, or something akin to it, is implemented during the summer, it will give the stock and bond markets one last boost. Most of the gains from a future QE3 have already been reflected in the market place. On the other hand such recognition by investors, not as yet discounted, will give a very large boost upward to gold and silver. As this takes place downward pressure will begin to appear in the stocks, bonds and the dollar. Those events will make it even more difficult to sell US Treasury and Agency bonds. Efforts will have to be added by the Fed to cover up the again ongoing losses of banks and brokerage houses – the financial sector – under the concept of too big to fail. The greater the effort needed to save these bankrupt institutions and the government the greater heights gold and silver will rise too. Adding fuel to the fire most other nations will have their own versions of QE3 compounding world inflationary problems. Even if a nation is not causing inflation they are forced to absorb foreign nation inflation whether they like it or not.

You have to look at the terrible fundamentals America is facing. The Fed has a balance sheet close to $3 trillion that could be $5 trillion in a year and one-half. If they purchase 80% of Treasuries and Agencies and bolster the declining economy. There is no end in sight for zero interest rates. Both the increases in money and credit and low interest rates will continue to send inflation into orbit. Monetization is the name of the game and the Fed and other central banks are playing it to the hilt. The ECB raises interest rates ½% and expects miracles. That could happen after they raise them 5% to 6%. Talk about misdirection as they continue to increase money and credit. They must think fellow Europeans and others are dumb and that is not the case. They knew as well as we do that what the Fed and ECB does causes monetization and inflation. Americans are used to inflation and heretofore they have been able to adjust for it. Other nations have not had that luxury in the past. Foreigners are far more sophisticated when it comes to propaganda and do not as easily fall for it as Americans do.

You would have to be stone dumb not to recognize the rampant inflation in the US, England and Europe. Gasoline and petroleum derivative products and food costs have gone up substantially. Not only in the regions but also worldwide. As a result inflation will be 14% in the UK and US by yearend and 8% on the Continent.
It is not only the federal government that is broke, but so are the states and municipalities in the US. Europe and England have the same problems. More than 40 states are struggling to balance their budgets. Most will, some will not and they’ll default on the interest payment on their bonds and probably have to pay vendors with IOU’s. There could be another federal bailout but we doubt it due to the battle over budget cuts in Washington. As these problems stand in the forefront the government’s debt dilemma is not going to go away anytime soon and over the next two years the US could experience a downgrade in its credit rating. Unfunded liabilities are $105 trillion and they are unfunded. Although stretched over years they still have to be paid unless benefits are adjusted.

We address the problems in Europe every week. Greece and its financial problems are still being negotiated. The discussion at hand only carries the shortfall in funding over the next year or two. The demand by banks for collateralization of debt by just about everything Greece owns has been rejected not only by the people, but by most of the politicians as well. Greece cannot pay its debt even over time and should default in part or in total. Again, the loans should have never been made and the bankers knew better. Similar conditions exist in Ireland and Portugal and Belgium, Spain and Italy could and probably will follow. One interest rate could never fit all. The euro zone is in deep trouble and the EU is starting to crumble at the edges. The sovereign lenders, German, France, the Netherlands, Austria and Finland, are very disturbed with the position they find themselves in. The Germans and the Finns have been quite vocal about the situation and recent elections in Germany made it quite clear that they do not want to fund any further loans. As we said a year ago $4 trillion will be needed to solve the problems and producing that kind of funding would certainly break the funding nations. As we said a year ago, the second half of 2011 will be full of dangerous problems. In the midst of all this we have the head of the IMF arrested and charged in what we see as an elitist power struggle with the US faction in the US entrapping a member of the European contingent to remove him from his position. It worked, but the fallout will be felt for many years to come. This intercene warfare is happening at a most unfortunate juncture in the midst of discussion involving Europe and the IMF and Greece and other debtor nations. These events have heightened the pressure on an already unstable situation.

As these events and problems unfold many nations, corporations and investors are reaching for gold and silver investments for safety, as they have many times in the past. The availability of physical metal is acute, as backwardation occurs in paper investments. That is spot markets are trading higher than outside months in a desire by former sellers to take delivery of gold and silver they previously sold. Those who are biding at spot are also offering those who want to take delivery a 25% to 30% bonus not to take delivery. That highlights how difficult it is to get delivery of silver. The same is true with gold, but delivery of physical is not quite as difficult. Control of the paper markets via frauds and manipulation is always present. Regulators, as appendages of the government, are in place to protect certain Wall Street insiders, harass the rest, allow the naked shorts to do as they please and try to put as many small brokers and firms as possible out of business, no matter what the cost. Then there are the frauds of front-running and flash crashes. The big question today is how do you stop fraud when it is institutionalized and Wall Street and banking are run by a crime syndicate in league with Washington? Just look at the trillions the Fed and the Treasury spread all over the US and Europe, which they were forced to divulge after their court appeal failed. The TARP funds episode was another example - $700 billion in free money for Wall Street’s Illuminist friends. That was one of the greatest frauds in history. A new movie is being released depicting Hank Paulson as having saved financial America, when in fact he and his friends were looting the American people.

As these events worsen the situation deterioration continues unabated, wars rage as distraction and for geopolitical positing. The costs of which are totally outrageous with the cost to the American taxpayer in the trillions of dollars.

The derivatives market is totally opaque and unregulated, Wall Street and the government want it that way so credit derivatives can be used to keep interest rates near zero and gold and silver and other items can be controlled by insiders.

We won’t hit the bottom of the residential housing market until 2013 or later. The end is still nowhere in sight, as Fannie Mae and Freddie Mac, Ginnie Mae and FHA make subprime and ALT-A loans. Commercial real estate is being held up and in place by the Fed, otherwise there would have already been a crash. These two shocks keep the economy headed downward with still yet no bottom in sight. Inventory for sale builds exponentially.

The flight from the dollar continues having entered its 3rd year of this credit crisis. Actually it is a continuation of 11 years of monetary policy, which has been centered on monetary expansion, which has been used to combat deflation and depression. The result has been ongoing continually rising inflation except for an interlude three years ago during a period of de-leveraging. The result of QE1 and stimulus 1 in 2011 will be 14% inflation. That will be followed by 25 to 30 percent as a result of QE2 in 2012 and in 2013 some 50 percent in 2014, the result of what will be known as QE3.

That is why countries, corporations and investors are moving to gold and silver. They want to dump depreciating US dollars and find safety for their assets. There is an enormous shift going on away from the fraudulent World Bank system and the massive debt accumulated by so many entities. The era of fiat money is coming to an end. Not far into the immediate future the whole world will be back on a gold standard because that is the only thing that works. BRIC countries, especially China, India and Russia and Iran want a gold backed currency. Many other nations are heading in that direction as well. This time the petro-dollar is not going to survive. The elitist’s forces in NYC and the City of London know this and they are trying to combat the dollar’s relegation as a non-world reserve currency. If they lose, and they most likely will, the US will be a big loser. The dollar no longer has the fundamentals and it hasn’t had them for many years, some 40 years. What is surprising to most professional observers is that it took so long for the system to approach collapse.

See the original article >>

CDS MARKET VS BOND YIELDS: REAL-TIME INEFFICIENT MARKET AT WORK

by Cullen Roche

We’re seeing one of those odd occurrences again where USA CDS are surging higher and bond yields are moving lower (thanks to Joe Weisenthal for pointing this out). Earlier this year I discussed the exact opposite phenomenon. What we were experiencing was a period of marginally higher inflation due to stronger economic growth and a flat line in USA CDS. At the time, many were talking about the stirring “bond vigilantes” and how they were about to bring their doom and gloom down upon the US economy. Of course, that didn’t happen and neither did the hyperinflation.

Today, it’s the US debt ceiling and our impending default that has investors worried for no reason other than their own lack of knowledge with regards to the real workings of a modern fiat monetary system. Interestingly, we’re seeing the exact opposite price action from earlier this year. USA 5 year CDS (priced in Euros) are rising and bond yields are falling. Markit provided a snapshot of the situation:
“The US, however, has seen its one-year spreads widen significantly in recent days and move well above the UK’s. The long-term fiscal challenges that the US faces are well-known but these are irrelevant for the short-end of the curve. Recent activity data from the DTCC shows that the number of trades referencing the US has gone up dramatically and was five times that of the UK last week. It appears to have been triggered by concerns over the US debt ceiling and the possibility of technical default. This seems far-fetched to European observers but is the subject of intense political debate in the US.”
But the 10 year US Treasury continues to decline. What in the world is going on here? Why aren’t yields pricing in default risk like the CDS market is? Well, it’s just another real-time view of the inefficient market at work.
The CDS market is concerned that there is some risk of a US technical insolvency so we see hedgers bidding up prices. The bond market, however, sees no risk of default. They see only lower inflation. Now, this is an obvious flaw in market dynamics for anyone who understands how our monetary system works. After all, there is no such thing as the USA being able to turn into Greece. There is no such thing as the USA being able to “run out” of the currency that only it can produce. It cannot become insolvent in the same manner that Greece can. As a sovereign monopoly supplier of currency in a floating exchange rate system with no foreign denominated debt it is entirely impossible for the USA to become insolvent in the traditional manner of not being able to make payments in the currency that only it can print (boy, that was a mouthful!).

The only form of insolvency that the US government could suffer would come in the form of hyperinflation. Regular readers are familiar with my research on this and know that I have believe hyperinflation has been a non-issue for many years now and still believe this today. So, if the USA was becoming insolvent yields should be surging as bond investors flee US Treasuries. Clearly, that’s not occurring. So, there’s a clear market inefficiency at work here. One of these markets is 100% wrong. And if you understand the workings of the modern monetary system it should be abundantly clear to you which market that is….

PREPARE FOR THE “FALSE GROWTH SCARE”

by Cullen Roche

Danske Bank has a nice piece of research out that provides the other side of the bearish view on all the recent economic data. They actually believe the data in the near-term will continue to be very weak. Specifically, they say the ISM data is likely to mean revert (something I wholeheartedly agree with). But they think it’s incorrect to get overly bearish because of this. In fact, they say it will result in a “false growth scare”:
“We believe that we are going to see more signs of weaker activity from different indicators in the coming months. For example, the US ISM manufacturing index is expected to decline in coming months as indicated by the Philadelphia Fed survey. Declines in PMI in other countries such as Euro Flash PMI for May point to a slowing global industrial cycle, which should become visible in the US as well.
Supporting the case for a stronger decline in the ISM manufacturing index is also that hard data have been much weaker than suggested by the ISM index. Firstly, GDP growth was actually below trend in Q1 rising 1.8% q/q annualised. Last time there was such a large divergence between GDP growth and ISM was in 2004 and subsequently we saw a quite fast decline in the ISM index (see chart on page 1). Secondly, industrial production has already slowed. The three-month annualised growth rate was only 1.8% in April, down from the strong levels in mid 2010 of 9.5%.
We believe this may contribute to another “false” growth scare as we have seen quite a few times, when ISM goes down fairly rapidly. At the same time, though, we look for US GDP growth to recover slowly already from Q2 and especially in H2 to a pace of 3.5-4% AR. This will very much mirror what we saw in early 2005 when ISM continued lower coming from a “too high” level relative to hard data while at the same time GDP growth stayed around 3% growth. The growth scare may be heightened by the ongoing budget discussions culminating in late July as we approach the deadline for a raise of the debt limit. This will put focus on the significant tightening of fiscal policy in 2012 and 2013.
As growth recovers and ISM stabilises during autumn, the growth scare should fade again, though, and we may see some relief that growth has not derailed after all.”
Ultimately, they see three primary factors continuing to power the economy higher – declining oil prices, improving jobs and improving credit trends:
“Three factors to support consumption in coming quarters However, the US households will benefit from three important factors:
1. Decline in oil prices: Since early May oil prices have fallen by app. USD15 to USD112 per barrel. We expect oil prices to stay lower and average USD116 for the rest of the year, which means that the PCE deflator is likely to fall back to around 2% by the end of the year giving a lift to real consumption growth of 2 percentage points. This means that more of the rise in nominal spending will feed into real consumption as less is absorbed by price increases.
2. Labour market improving: Another important factor that will underpin consumption growth is the rise in nominal income growth stemming from the improving labour market situation – see Flash Comment: US payrolls point to solid income gains. In April our income proxy derived from the US employment report rose to 5.5%. This income growth stems from a stronger rise in payrolls of 244k and a rise in average hours. Wage growth, though, is very subdued (around 2%) and is dampening overall income growth. In coming quarters we expect job growth to continue around 225-250k and we look for a further rise in average hours. Wage growth is expected to stay low, but in total this should keep nominal income growth in coming quarters around 5-6%.
3. Credit growth rising: The latest Senior Loan Officer Survey pointed to further improvement in credit standards for households and a stronger willingness to lend. Consumers’ demand for credit is also on the rise. This will increasingly underpin private consumption on top of the robust income picture.
In sum, the fundamentals for private consumption look fairly solid and we expect private consumption growth to climb steadily higher in coming quarters to 3.0% in Q2 and 4.0% in Q3 as the headwind from oil prices eases gradually and real income growth rises (there is normally a lag of 1-2 months from oil prices to the PCE deflator). The savings ratio is expected to be broadly flat around 5.5% – as has been the case over the past year after the sharp correction higher during the financial crisis.”
I think this is a pretty reasonable outlook for now. The near-term downside in the economic data will create a headwind for markets, however, I wouldn’t become overly scared about a double dip unless the European crisis gets out of hand, austerity hits the USA or China’s slowdown proves to be something closer to a hard landing.

Forecasts: What and How Do Business Economists Think?


The WSJ and Philadelphia Fed surveys of economists were released last week. It’s of interest to consider what they imply for the macro outlook, and additionally, how they believe inflation will evolve as a function of other variables.

The Macro Outlook
Because the WSJ and SPF forecast mean are essentially the same for GDP, I’ll focus on the WSJ forecasts. Figure 1 depicts the forecast mean, and trimmed high and low forecasts (where trimming is based on the five quarter growth rates).
wsji1 economy
Figure 1: GDP (blue), WSJ forecast mean (red), and trimmed high (Lavorgna/Deutsche Bank) and trimmed low (Leamer/UCLA) (gray), all in bn Ch.2005$, SAAR. Trimming removes top and bottom five respondents. NBER defined recession dates shaded gray. Source: BEA, 2011Q1 advance release, WSJ May 2011 survey, NBER, and author’s calculations.

Forecasters predict continued growth. However, there is some dispersion of forecasts. Moreover, while growth is predicted to continue, it will not be at such a pace to quickly close the output gap.
wsji2 economy
Figure 2: Log GDP (blue), WSJ forecast mean (red), and trimmed high (Lavorgna/Deutsche Bank) and trimmed low (Leamer/UCLA) (gray), and potential GDP (CBO January 2011), all in bn Ch.2005$, SAAR. Trimming removes top and bottom five respondents. NBER defined recession dates shaded gray. Source: BEA, 2011Q1 advance release, CBO, Budget and Economic Outlook (January 2011) data, WSJ May 2011 survey, NBER, and author’s calculations.

Figure 2 indicates that by 2012Q2, forecasters are projecting output at 3.8% below CBO projected potential GDP (in log terms). The trimmed high is 3% below, while the trimmed low is 4.5% below. Even a 3% output gap by mid 2012 is substantial, and suggests to me that policymakers need to be extremely circumspect about tightening policy over-rapidly.

The graph is useful in reminding us of the cost of the recession, which started in 2007Q4. As of 2011Q1, the cumulative output shortfall relative to potential GDP was 2.1 trillion Ch.2005$. Using the WSJ mean forecast, as of 2012Q2, the cumulative output shortfall will be 2.9 trillion Ch.2005$ — and the output gap will still be 3.8%!

These forecasts are conditional upon certain policy measures. One of those is monetary policy; here it is of interest to note what monetary policy is assumed to do.
wsji3 economy
Figure 3: Fed Funds (red), WSJ forecast mean (red squares), ten year constant maturity (blue), and ten year note yield (blue triangles), all in percentage points. NBER defined recession dates shaded gray. Source: St. Louis FREDII for interest rates, WSJ May 2011 survey, and NBER.

What is interesting to me is the fairly gradual upward trajectory for the ten year interest rate — and how those projected interest rates compare against those earlier in the decade.

I can understand how some people might ask how interest rates can be so low with such a large budget deficit. But in a loanable funds framework, saving and demand for total credit determines the price of bonds, and as long as private demand for credit is depressed (consistent with a 3% output gap), real rates should remain relatively low. Shocks to risk appetite could also induce flight to US Treasurys.

An alternative interpretation of these rising interest rates is that inflation is expected to rise, despite the fact that Treasury-TIPS spreads and other measures of expected inflation [0] exhibit muted pressures. The short to medium term inflation expectations are also muted in the WSJ survey:
wsji4 economy
Figure 4: Actual CPI y/y inflation (blue), WSJ forecast mean (red squares), and trimmed high (Riding,DeQuadros/RDQ) and trimmed low (Harris/UBS) (gray +), all in percentage points. NBER defined recession dates shaded gray. Source: St. Louis FREDII for interest rates, WSJ May 2011 survey, and NBER.

Inflation Dynamics

One interesting question, given the pervasive (among some circles) belief that hyperinflation is just around the corner, is what determines inflation. The Phillips curve posits current inflation is a function of expected inflation, the output gap, and input price shocks. 

π t = π et + f(yt-y*t) + Z t

Where π is inflation, the e superscript denotes expected, (yt-y*t) is the output gap, and Z is a function of the growth rate of input prices. For average inflation rates close to zero, the expected inflation term can be approximated by zero.

The WSJ survey does not contain an estimate of the output gap, but one can take a look at how forecasted inflation rate over the next year correlates against the forecasted growth rate of GDP:
wsji5 economy
Figure 5: Average forecasted y/y inflation versus average q/q annualized growth, all in percentage points, excluding James Smith/Parsec Financial Management, n=53. Nearest neighbor fit (bandwidth=0.3). Source: WSJ May 2011 survey, and author’s calculations.

Running a regression of average forecasted inflation against average forecasted growth, and the change in the average forecast oil price from $100 leads to the following estimates.

Ï€ t = 1.05 + 0.53 × Î” yt + 0.176 × Î”Poilt
Adj-R2 = 0.32, SER = 0.052, d.f. = 52.

Where Δ yt is the average q/q growth rate, and ΔPoilt is the change in the average price relative to $100, and bold coefficients are statistically significant at the 10% msl. In words, most business economists believe more rapid growth is associated with higher inflation. It’s possible that it’s monetary policy that is believed to drive both growth and inflation jointly (of course, that would be inconsistent with what has often been characterized as a Keynesian view of the world, but consistency and familiarity with data is not a strong point amongst those who are most worried about hyperinflation [1]).

Proxying the looseness of Fed policy by average Fed funds rate in 2011, one finds there is no link of looseness with higher inflation in 2011-2012. In fact, it is the reverse; in a OLS regression, higher average expected inflation in 2012 is associated with tighter policy in 2011, significant at the 5% msl (and with higher increase in oil prices). (The adj-R2 = 0.12.)
wsji6 economy
Figure 6: Average forecasted y/y inflation in 2012 versus average average Fed funds rate in 2011, all in percentage points, excluding James Smith/Parsec Financial Management, n=53. Nearest neighbor fit (bandwidth=0.3). Source: WSJ May 2011 survey, and author’s calculations.

In other words, expected inflation does not appear to be primarily a function of loose monetary policy. Rather, it appears to be driven by factors consistent with a Phillips curve relationship obtaining.

Views on Policy

Economists in the business sector tend to have a view of the world consistent with an expectations and supply augmented Phillips curve, and inconsistent with a strict monetarist/Quantity theory view (or a strict real business cycle view).

It’s of interest, then, to consider what their views on the policy outlook are. Figure 7 highlights the monetary policy outlook.
wsji7 economy
Figure 7: Quarter in which Fed begins raising the Fed funds rate (blue bars) and when the Fed begins exiting quantitative easing by allowing “mortgage-backed securities to mature without being reinvested.” Source: WSJ May 2011 survey.

The modal quarter for QE exit is 2011Q4, while that for Fed funds tightening in 2012Q1. I can see how these dates can be rationalized within the context of a sustained, albeit moderate, recovery in GDP. However, I worry about overly rapid tightening against a backdrop of ill-advised over rapid tightening of fiscal policy.

This is particularly important to recall, in this time of fears of debt accumulation, that much of the accumulation of debt as a share of GDP occurs because of Bush era fiscal policies and the economic downturn, as highlighted by the CBPP:
wsji8 economy
Source: CBPP.

One can see that a large chunk of the debt accumulation is attributable to the 2001 and 2003 tax cuts. The economic downturn is another key contributor.

As Aizenman and Pasricha observed, the fiscal stimulus merely offset the Contractionary effect emanating from the state and local government spending cuts and tax increases. The proposals to cut spending out of the next fiscal year’s budget, without addressing out-year spending and revenue, will merely increase the dark blue component (“economic downturn”) in the above graph.

The WSJ economists (not a notably liberal group, when it comes to economics) also do not appear to be strong adherents of the “expansionary fiscal contraction” view (see my views here and here). In the March survey, the response to the question “Will cutting the federal budget by an annualized $100 billion this year help or hurt economic growth over the next two years?”, was roughly 50-50. My favorite quote was “Claims that cuts are stimulative in the short run are nonsense.” I think we should take this comment to heart, as we wonder if oil prices and other shocks might push us below “stall speed”.

See the original article >>

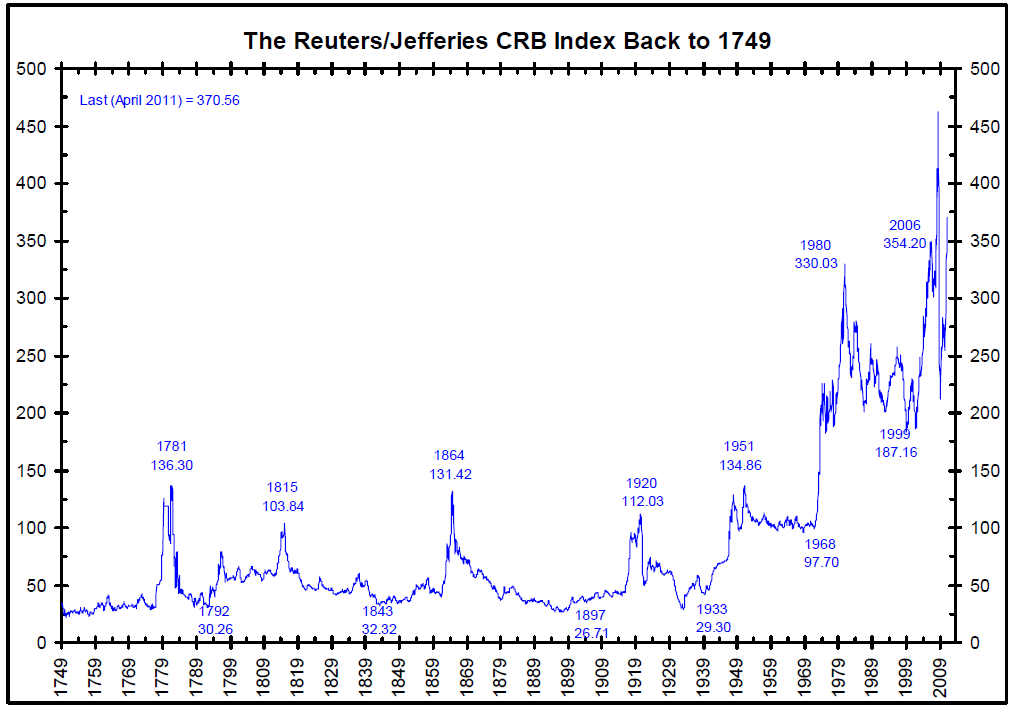
Reuters/Jefferies CRB Index 1749-2011

By Barry Ritholtz

I love this CRB chart via Jim Bianco of Bianco Research:
>


See the original article >>

Follow Us