Tuesday, May 24, 2011

Silver Panic Selling, Is it Possible to Have Panic Buying?

By: EWI

"Panic selling" is easy to understand and recognize: Investors rush to sell from the fear of loss. No more explanation necessary. 

On the other hand, "panic buying" is not easy to see for what it is. The phrase seems to clash with itself. People commonly assume that "buying" involves rational choices by investors, who assess risk, calculate entry points, establish stops, etc. 

None of that happens in a panic. So how can you have "panic buying"?

For starters, you have it when fear actually motivates investors to buy. 

Whereas fear of loss motivates panic selling, investors get in a buying panic when they're afraid of missing out on the profits they see everyone else making. 

Such as, for example, panic buying in the silver market from late January through late April of this year. Buyers drove prices from $26.40 per oz. (Jan. 28) to $49.80 (April 25), a gain of more than 80 percent in under three months.

You probably have a good idea of what followed in the first week of May: more than half those gains vanished in four trading sessions. The direction changed, but the emotion did not. Fear inflated and deflated the same bubble.

This excerpt from Elliott Wave International's free issue of Global Market Perspective depicts that panic.
The chart below shows that daily trading volume in the exchange-traded fund, the iShares Silver Trust (SLV), surged to a record 189 million shares on April 25, days prior to silver’s peak. Then, just a few days after the peak, on May 5, it reached nearly 300 million shares, another record. The first record was on buying fever, the second on a selling panic. As shown on the chart, both levels far surpass the daily trading volume in the S&P 500 SPDR (SPY), which is generally the most heavily traded fund in the world.
Through Wednesday, seven out of the past nine days have seen the daily volume in SLV outpace that of SPY. This is unprecedented behavior. “Day traders are going crazy,” says the head of trading at one brokerage firm. “Investors who felt they may have missed the boat with gold have jumped into silver because it has a better price point,” said a precious metals analyst. A Bloomberg story attributes the rise in SLV’s volume to “worries about inflation and the weakness in the U.S. Dollar.” But the real reason, in our view, is simply the same old mania story. Higher prices in silver got people more excited about the prospects of even higher prices, as they always do. The excitement hit a speculative crescendo when SLV reached a new high of 48.35 on April 28, unconfirmed by the price of the metal itself.

Bearish Outlook for Crude Oil


Last Wednesday we told subscribers that the day's upmove in WTI crude oil futures from $95 to $101 was not the start of a new upleg. We noted that the pattern exhibited on the daily chart since the May 7 at $94.63 to Wednesday's high at $100.99 resembled a bear flag formation much more than a significant bottom. It had the look of a digestion-consolidation pattern in the lower quadrant of the larger downleg from May 2's $113.97.

The analysis remains unchanged, and still argues for another downleg into the $90-$88 area next, which should also negatively impact the U.S. Oil Fund ETF (USO) as well as oil & gas names.

Only upside continuation that hurdles and sustains above 106.20 will invalidate the current "bearish" outlook.


See the original article >>

Stock Market Uptrend Still Weakening

By: Tony_Caldaro

Another choppy week that ends in the red for the third time this month. Economic reports were definitely on the negative side outnumbering positives by 9:2. On the positive side the weekly Jobless claims improved and the Monetary base rose. On the negative: the NY/Philly FED both declined, along with Housing starts, Building permits, Industrial production, Capacity utilization, Existing homes sales, the WLEI and Leading indicators. The NAHB index was flat.

Markets, worldwide, held up fairly well. The SPX/DOW lost 0.5%, and the NDX/NAZ was -1.1%. Asian markets were off 0.4%, as were the Commodity equity group. Europe dropped 0.9%, but the DJ World lost 0.5%. Bonds gained 0.2%, Gold added 1.1%, Crude was +0.1%, and the USD lost 0.2%. Next week offers the second estimate to Q1 GDP, Durable goods orders and Personal income/spending.

LONG TERM: bull market

While recent market activity leaves a lot to be desired. Long term prospects for the stock market continue to look bright. Our bull market count, from the SPX 667 Mar09 low, remains intact. We continue to anticipate a five Primary wave bull market, and two of these Primary waves have already completed. Primary wave I in Apr10 at SPX 1220 and Primary wave II in July10 at SPX 1011. Primary wave III began at that low. The first Primary wave divided into five Major waves: Major 1 in Jun09 at SPX 956, Major 2 in July09 at SPX 869, Major 3 in Jan 10 at SPX 1150, Major 4 in Feb10 at SPX 1045 and Major 5 in Apr10 at SPX 1220.
Primary wave III should also be dividing into five Major waves. Thus far, Major 1 in Feb11 at SPX 1344 and Major 2 in Mar11 at SPX 1249. Major wave 3 should be underway now. We do, however, offer an alternate count which suggests Major wave 2 is still unfolding. This count is posted on the DOW daily chart.


MEDIUM TERM: uptrend high SPX 1371

The current uptrend from the Mar11 low at SPX 1249 has been a bit choppy of late. The two significant rallies, thus far, were from SPX 1249-1339, a drop to 1295, then another rally to 1371. Since the uptrend high was hit on the first trading day in May the market has done nothing but work its way lower in a series of zigzags. The low thus far, SPX 1319, was hit on tuesday. We can count this uptrend with three possible counts. The next couple of weeks should determine the most probable outcome.


The first count is posted on the SPX hourly/daily charts. This suggests an ongoing Major wave 3 uptrend that has subdivided into, first Intermediate waves i and ii then Minor waves 1 and 2. Minor wave 3 should be underway now. Should the recent SPX 1319 hold and the market rallies to new highs this is the correct count.

The second count is posted on the DOW hourly/daily charts. This suggests the entire uptrend is an Intermediate B wave rally of Major wave 2. The decline into Mar 11 at SPX 1249 was Intermediate wave A, the rally to SPX 1371 this month was Intermediate wave B, and Intermediate wave C is currently underway. The final outcome would suggest a correction back down to around SPX 1249. Since most of the foreign indices we track are in confirmed downtrends this count is gaining in probability.


The third count we modified this weekend. This suggests the entire uptrend from SPX 1249 to 1371 was Intermediate wave i of Major wave 3, and Intermediate wave ii is currently underway. While the wave structure, at first look, appears to be three waves. We can count five waves using OEW techniques. This wave count also seems to align with some of the foreign markets we track. The final outcome under this count would suggest a correction back to around SPX 1295. Overall the weekly MACD suggests the market is in some sort of correction mode.


SHORT TERM

Support remains at the OEW 1313 and 1303 pivots, with resistance at the 1363 and 1372 pivots. The uptrend high is SPX 1371. Short term momentum has been heading lower since it nearly hit extremely overbought on thursday. The market action for the past three weeks has been quite choppy. Most of the commodities are in downtrends, the Euro is downtrending, and 9 of the 15 world indices we track are in downtrends. This is not what one would expect during an EW third of a third. It is more in line with correction activity.


In the first week of May last year, commodities dropped hard and the SPX experienced the “flash crash”. This sent the SPX into a three month, 17% correction. The first week in May this year, commodities dropped hard but the SPX has only drifted down for a 3.8% loss thus far. The wave activity, however, does again look correctional. Last year at this time the FED was completing its QE 1.0 program. This year it is completing its QE 2.0 program. The uncertainty of what lies ahead has definitely impacted the market as, just like last year, the economy is weakening again.

The short term parameters are quite clear. Last week the SPX entered the OEW 1313 range, (1319), and then rallied. The week before it entered the OEW 1363 pivot range, (1359) and then declined. A breakout above or breakdown below these pivots should determine the outcome of the current trend. Best to your trading!

FOREIGN MARKETS

Asian markets were mostly lower on the week for a net loss of 0.4%. Four of the five we track are in confirmed downtrends.

European markets were mostly lower as well for a net loss of 0.9%. Two of the five we track are in downtrends.

The Commodity equity group were also mostly lower for a net loss of 0.4%. All three of the indices we track are in downtrends.

The weakening uptrend DJ World index lost 0.5% on the week.

COMMODITIES

Bonds are uptrending and gained 0.2% on the week. 10YR rates have declined to 3.15% and the 1YR is bouncing along the bottom at 0.18%.

Crude is downtrending but gained 0.1% on the week. Crude appears to be bouncing off the recent $95 low.

Gold is still uptrending, +1.1% on the week, but needs to continue its recent rally to maintain the uptrend. Silver and Platinum are in downtrends.

The USD is close to confirming an uptrend, but lost 0.2% last week. The EUR (+0.3%) is already downtrending. The uptrending JPY lost 1.1% on the week.

See the original article >>

MARKET MINUTE – A GLOBAL SLOWDOWN?

by Cullen Roche

A little over a month ago I described the biggest risks to the market currently. It has been my position for several years now that we remain in a balance sheet recession and that growth has been largely salvaged via deficit spending and strong Chinese growth. The risks in such an environment are rather simple. Because the EMU is not helping their periphery brethren the depression on the periphery is certain to continue. It’s only a matter of time before this hurts growth in the core. Europe requires a structural fix. They’re far from achieving that.

In China, they implemented a highly flawed stimulus package (they did not have the banking crisis the USA had, yet they responded with the same medicine) and the result has been a seesaw in inflation. We’re now on the downswing as high inflation naturally causes reduced demand.

In the USA, the recovery is largely due to deficit spending as the private sector remains weak and deleveraging. Thus far we’ve managed to sidestep the global cries for austerity, however, it is beginning to look like spending cuts could come to fruition as the fear mongering over the debt ceiling gives Republicans a bargaining chip.

There was a huge amount of global news this morning and unfortunately for equity investors it’s all bad. We hit every corner of the globe with manufacturing news. First up, Europe, where the Flash Output Index from Markit sank to its lowest level since November 2008. Markit elaborates:
“The Markit Flash Eurozone Composite Output Index, based on around 85% of usual monthly replies, fell from 57.8 in April to 55.4 in May to signal ongoing expansion for the twenty-second successive month. However, although in line with the average seen during 2010, the increase was the weakest for seven months and the deceleration in the rate of growth, as measured by the fall in the index, was the largest since November 2008.”

The above chart is important as it shows just how weak the periphery nations are compared to the core. As regular readers know, this highlights the flaw in the single currency system. The core nations, which are trade surplus nations, are the winners in such a system as decades of trade deficits in the periphery nations inevitably led to excessive government spending. The periphery nations find themselves without a floating exchange rate to help balance trade so the situation has devolved into what we see today – several of these nations are bankrupt. Unfortunately, the situation is unsustainable. Real reform MUST happen. I have maintained for over a year now that that will involve defaults/defections and a more unified core Europe as a result. European leaders appear unable to resolve the structural flaws in the Euro so the situation is spiraling out of control. It’s only a matter of time before the citizens become increasingly upset with the depression that is being imposed on them. This situation is highly combustible and nearly impossible to predict.

China’s Manufacturing sector appears to be slowing. The monthly flash PMI showed growth slowing to a 10 month low (via Markit):
  • Flash China Manufacturing PMI™ at 51.1 (51.8 in April). 10-month low.
  • Flash China Manufacturing Output Index at 50.9 (51.8 in April). 10-month low.

Commenting on the Flash China Manufacturing PMI survey, Hongbin Qu, Chief Economist, China & Co-Head of Asian Economic Research at HSBC said:
“The Flash manufacturing PMI eased further to 51.1 in May, the lowest level since July 2010. Manufacturers continued to reduce inventories amidst slowing new business flows, leading to slower production growth at a 10-month low. That said, we think that there is no need to worry about a hard landing because the current level of the PMI is still consistent with around 13% IP and 9% GDP growth. Policy focus is still tilted towards taming inflation. We expect Beijing’s tightening policy will continue in the coming months.”
China has been the one strong leg of the global growth story over the last 2 years. It’s my opinion that misguided domestic stimulus programs led to the current mini-boom in the Chinese economy and we’re now experiencing the inevitable downside involved in misguided government intervention as inflation has sapped demand by forcing consumers to reallocate spending. QE2 exacerbated the commodity boom via speculation. The air is now coming out of that bubble. The risk now, is that the Fed has created a highly unstable market in commodities that will result in production concerns and exacerbated economic fears.

In the USA, we continue to see weakening manufacturing data. This morning’s Chicago Fed Index is consistent with several of the recent regional reports as well as the latest ISM Services data. This month’s decline was the lowest reading since August 2010:
“Led by declines in production-related indicators, the Chicago Fed National Activity Index fell to –0.45 in April from +0.32 in March. April marked the lowest reading of the index since August 2010. Three of the four broad categories of indicators that make up the index deteriorated from March, but two of those three categories made positive contributions to the index in April.”
The risks have certainly increased in recent months as the manufacturing boom appears to be softening around the globe. I believe the highly misguided QE2 program has substantially contributed to the current downturn around the globe as speculators drove many prices well beyond sustainable levels. Real GDP has slowed every quarter since the beginning of QE2. We should all hope that the Fed doesn’t respond to the current downturn with more of the same misguided medicine.

JEFF SAUT: KEEP AN EYE ON THE 50 DAY MOVING AVERAGE

by Cullen Roche

Like Richard Russell, Jeff Saut of Raymond James is keenly focused on the technical aspects of the current market environment. Saut says this is a decisive week as any break of the 50 day moving average could result in further declines:
“Two weeks ago I said, “While the intermediate/long-term internal stock market energy remains fully charged for a move higher, the market’s short-term energy still needs some time to rebuild. This probably means another week, or two, of consolidation and/or attempts to sell stocks down before we begin another leg to the upside. Even so, I don’t think any selling will gain much downside traction, implying the zone between the S&P 500’s 50-day moving average (DMA) at 1320 and the 1340 level should provide support for stocks.” Well, it’s now two weeks later and from my lips to God’s ears because the S&P 500 (SPX/1333.27) did exactly that last week when it tested its 50-DMA and proceeded to bounce above 1340, which I thought would confirm the successful test of the 1320 level. Alas, that wasn’t meant to be as once again Friday’s Fade (-10.33 SPX) left the SPX right in the middle of my 1320 – 1340 support zone. Still, the action has not negated the “call” for a move above 1400 by the end of June provided the SPX doesn’t decisively violate the 50-DMA to the downside.”
As I type, the S&P is about 8 points below its 50 day moving average. If Mr. Saut’s thesis plays out we could see a bit of a bounce at these levels, however, if the decline this week persists then it could be time to look out below.

All Major Global Equity Markets Close Below Their 50-day M.A.

By Global Macro Monitor

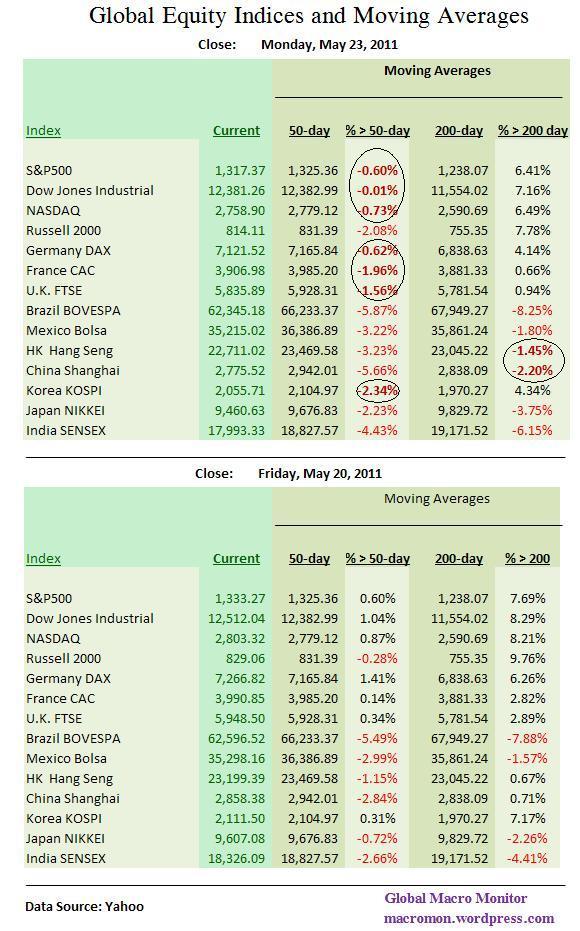
What a difference a trading day makes. As of Friday’s close only seven of the fourteen major global indices that we track were below their 50-day moving averages. As of today, they all are. The S&P500, Dow (just barely), Nasdaq, all three European, and the Korean Kospi broke their 50-days. The Hang Seng and Shanghai fell sharply to close below their 200-day moving averages.

Some positives were the VIX, after opening at 19.55, traded lower almost all day. The S&P500 filled the April 19-20 opening gap at 1312.70-ish and held. The BOVESPA and Mexican Bolsa were able to muster impressive bounces off their opening lows. And, finally, Apple, after probing the key support level of $327.50, closed up $5 off its low of $329.42. Given the attack of the Macro Swans and lack of upside catalysts, tough to see how we bounce big here, other than some nutcracking short covering. Let’s see what Turnaround Tuesday brings us. (click here if table is not observable)
>

See the original article >>

Follow Us