Friday, February 18, 2011

Why Hasn't the VIX Broken to New Lows?

by Bespoke Investment Group

Much has been made recently about the big drop in market volatility, but while the VIX is no doubt at low levels, it has failed to break to new lows for a couple of months now.  Typically the VIX falls when the market rises and rises when the market falls.  As shown below, however, the VIX has been moving sideways around the 16 level as the market has been rallying since December.  During the last bull market, the VIX moved into the single digits, so it's not like 16 is some kind of floor. 

What does this failure of the VIX to move lower mean for the market?  We're unsure, but basic technical analysis of the VIX chart would suggest that it's headed higher, which historically has coincided with stocks heading lower.    


Continue reading this article >>

Greenland: Final Frontier for Rare Earth Elements, Uranium, And Much More

by Joseph L. Shaefer

Greenland may have been barren and cold in the 1800s, when this shanty became popular. But it wasn’t always so and, in the natural rhythms of Mother Earth’s warming and cooling, may not be so cold and barren in the near future. I haven't been to Greenland, but I have flown over it numerous times. I can assure you there is much green and brown as well as white and ice blue on that great island.

The name Greenland probably comes from the Norwegian Erik the Red, who sometime around 982 was exiled from Iceland for several murders, the circumstances of which were rather murky, with the victims being members of a powerful local family who had murdered members of Erik’s family. Nonetheless, he was exiled from Iceland for three years and henceforth set out with his extended family to find someplace where the reception would be warmer, if not the climate.
He may or may not have been the first Norseman to see Greenland (most accounts credit earlier visits of 50 and even 100 years) but it was Erik the Red who put it on the map (and his son, Leif Ericson, who later put the continent of North America on the map.) Erik allegedly called the place upon which he alighted Grœnland, or Greenland, in hopes of attracting other settlers to join him. (A technique that has been used by numerous real estate developers ever since, naming their tumbleweed-strewn
desert lots Shady Acres, Mountain Shadows, Montreux Estates, and so on.)

It's important to note that about this same time what we call the “Thule peoples” began migrating from Alaska and by 1300 had settled in Greenland, displacing many of the then-native peoples as they brought such innovations as whaling harpoons and dog sleds with them. The Norsemen who came with Eric the Red, as well as those who followed after him, both taught and learned much from the native peoples and, later, the Thules they encountered. And, in the tradition of humans everywhere, they also fought with and killed each other from time to time.

These were not people huddling in caves, however, seeking haven from the ravages of continual winter. Ice core samples and clamshell-dated artifacts both clearly show that during this time frame, from roughly 900 to at least the 1300s, herbaceous trees and plants grew in Greenland, wine vines were planted, livestock were introduced, and plants such as barley -- essential for beer, whiskey and other necessities of life -- were grown. Given the natural ebb and flow of climate change on earth over the millennia, it may be that Greenland will once more be truly green.

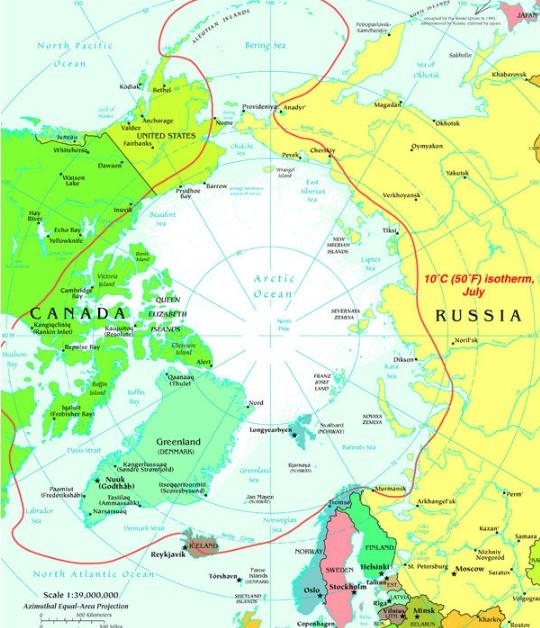
In fact, scientists recently probed 1.2 miles through a glacier in Greenland to recover the oldest plant DNA on record -- finding the DNA of trees, plants, butterflies and spiders from some 450,000 to 900,000 years ago – providing yet more evidence of natural global warming long before man appeared on the scene. With all this in mind, I invite you to take a close look at the map below (click to enlarge):

Before you write Greenland off as some Arctic Circle wasteland, please note that the southern tip of that great island lies just below the 60th latitude north. Note as well that sunny-in-the-summer Norway and Sweden lie mostly north of that same latitude (with major cities Oslo, Stockholm, Helsinki, and St. Petersburg, Russia, lying almost exactly along the parallel), with Finland and almost all of Alaska entirely north of it – just like Greenland -- though I hasten to note that Norway in particular, and Scandinavia in general, also benefit from the warm Gulf Stream currents...

Now consider where the massive discoveries of natural resources have taken place in recent years: oil and gas from the North Slope of Alaska, the north of Canada, the North Sea between Norway and Scotland, and the Russian north. Coal, iron, nickel, tungsten, gold, silver and rare earth elements (first discovered near the town of Ytterby, Sweden, to the northeast of Stockholm just below – you guessed it – latitude 60) are but a few of the other treasures the north has offered up.

Now if you look at the world from the view point of the map above, it simply makes sense that Greenland might also have been dusted with or surfeited with some of the same minerals and resources that its geologically-similar cousins in Russia, Canada, the US (Alaska) and the Nordic nations have. The Nordic nations are comprised of Iceland, Norway, Sweden, Finland, and Denmark, all of which have the bulk of their land mass north of Latitude 60 except for Denmark – but, then, since Greenland is currently “affiliated” with Denmark, we can’t exclude Denmark from this analysis.

(It’s a long story but the short version is: the Norwegians took responsibility for Greenland in the 1300s. Later, after combining with each other, rebelling from each other, etc., Norway and Denmark split for good in 1814. Denmark got Greenland. Greenland became an official and integral part of their kingdom in 1953. It was granted home rule by the Danish Parliament in 1979. In 2009, Greenland assumed self-determination with responsibility for self-government of judicial affairs, policing, and natural resources. Denmark maintains control of foreign affairs and defense. As part of the realm of the Kingdom of Denmark, Greenlanders elect two representatives who sit in Denmark’s Parliament. Ultimately the split will be final and Greenland will stand on its own.)

With the abundance of riches clearly discovered north of Latitude 60 by other nations, why do we hear nothing of such discoveries in Greenland or in the fecund waters surrounding Greenland? The answer lies in the political, cultural and ecological realms, not in the geologic or geographic. Denmark has done an admirable job of protecting the Inuit culture from outside influences. (88% of the some 58,000 Greenlanders are Inuit or mixed Danish and Inuit. The remaining 12% are mostly Danish. Almost all Greenlanders reside along the fjords in the south-west of the main island.) So currently fishing and ice fishing are the dominant means by which Greenlanders provide themselves with sustenance, just as they always have. In seasons with good catches, they depend upon fish and arctic shrimp for critical export products to trade for goods from elsewhere.

But that political and cultural decision to continue a certain way of life may or may not reflect the desires of native Greenlanders as they take their place among the nations of the world. Certainly they have shown a clear interest in the past in improving their standard of living by allowing other forms of exploration for valuable minerals and other natural resources.

Cryolite was discovered in Greenland in 1799 and has been used over the years to make caustic soda, as an insecticide and a pesticide, and, most significantly, in the production of aluminum. More recently, their state oil company, Nunaoil conducted a good deal of seismic research in Greenland’s coastal waters – enough so that third-party seismic data providers have found it profitable enough to take that task on themselves.

The state company Nunamineral has been seeking capital to increase the production of gold, which began in 2007. In that same year, their mining of ruby deposits also began. There is even a public company which became involved in ruby mining in 2004, which I’ll discuss below. And there are numerous other minerals projects just getting launched seeking likely deposits of uranium, aluminum, nickel, platinum, tungsten, titanium, lead, zinc and copper.

So – is Greenland the Final Frontier? With apologies to fellow Star Trek fans, it is certainly the largest land mass and continental shelf area that remains relatively unexplored on this planet, anyway. I say yes – Greenland is a place for brave investors to begin learning more about!

Among the ways I see as possible to participate would be the likelihood of responsible drilling for oil and gas offshore. Greenlanders cannot endanger their prolific fishing grounds, so they will most likely select shallower areas initially or the most experienced deeper-area operators with the most sterling safety records. I have crossed the North Atlantic twice via ship and seen its icebergs and gales firsthand. Make no mistake, these are treacherous waters. Two of our favored companies, both in our model portfolios, excel in this area. Both – no surprise – are Norwegian. No one has greater experience and a better safety record drilling in extreme environments than the Norwegians. I’ve also crossed the Skagerrak (the straits between Norway and Denmark) in 40-foot seas. My hat is off to anybody who can safely drill in those waters!
The first of these companies is Statoil (STO), partially owned by the Norwegian government, but which trades on the NYSE for the rest of us, and is quite liquid. Since I’ve written about it recently, let me suggest you take a look at that discussion rather than re-hash it here.

The second, which I’ve also suggested for your due diligence in an SA article here is Norway’s SeaDrill (SDRL), the world’s most successful deepwater driller and the one with the newest fleet of deepwater rigs. (In addition I mentioned both firms, among others, while advocating a safer approach to emerging markets, less than a month ago here.)

You may have other mineral, oil and gas, or other resource firms your due diligence has led you to. I suggest that if they are truly global thinkers and planners they, too, are quietly taking a look at Greenland as a not-too-distant future possibility.

There are a few “penny dreadfuls” which have already established a beachhead in Greenland and have contracts or actual ongoing operations there. I use the term penny dreadfuls not to be derisive – every firm has to start somewhere and some of these may go on to become giants – but because these firms are typically characterized by a large number of shares outstanding, as well as warrants and options granted to management and anyone providing them with capital. They are also characterized by a continuing need for capital since they usually have as yet no positive cash flow from their current operations. Since few bankers are willing to lend to them (Assets? What assets?) they must keep diluting current shareholders’ positions by issuing new stock.

With that (very large) caveat in mind, let’s take a quick look at a couple of these. I mentioned a ruby miner above. Their home page tells me “WE’VE DISCOVERED a new source of rubies that rivals those found in Burma,” and “YOU’VE DISCOVERED the opportunity to make a solid investment.” I was a defense attaché in Burma and I’m just not certain anyone can claim, at this early stage, that these rubies are their equivalent.

But, more, I dislike companies whose primary pitch, right on the home page, is to “investors” to pump up the stock price and not to vendors, buyers of their gems, and other stakeholders. Still, if that’s your thing, True North Gems (TNGMF.PK), at 12 ½ cents, down from a previous speculative blowoff in 2003 of 95 cents, but up from 8 cents in September, may just be your “buy ‘em when they’re cheap” kind of a gamble. They’ve been working each summer since 2004 to define their prospects and take some samples. The company has sapphire, emerald and nickel prospects in Canada, as well.

Greenland Minerals (GDLNF.PK) may not excite some as much as TNGMF, but it’s more my cup of tea. From a low of 10 cents at the bottom of the market in March 2009, it is now $1.38. I still like this Australia-based miner’s prospects, even at this price. In December, GDLNF received approval from the government of Greenland to fully evaluate the Kvanefjeld multi-element project, including radioactive elements like uranium. Why is this a huge deal? The Danes have a very “conservative” policy about anything nuclear. Despite their neighbor once-removed, France, deriving 75% of their electrical energy from safe, quiet, non-polluting nuclear, the Danes are dead-set against the stuff. They have never allowed so much as an analysis of just how much uranium might reside in Greenland.

Yet Kvanefjeld is a large mineralization deposit near the southern tip of Greenland that is rich in rare earth elements (REEs), uranium, and zinc. It is suspected to contain one of the world’s largest resources of REEs. The only question is whether the Greenland government will allow them to extract those REEs, knowing that some uranium may be moved or, with permission, extracted in the process. I'm guessing they will allow both. As the company says, "The Kvanefjeld Project is recognised as the world’s largest undeveloped JORC-compliant resource of rare earth oxides (REO), in a multi-element deposit that is also enriched in uranium and zinc." (The JORC Code comes from the Australasian Joint Ore Reserves Committee and is designed to assure minimum standards for public reporting to ensure that investors and their advisers have all the information they would reasonably require for forming a reliable opinion on the results and estimates being reported.)

In addition, the company has delineated yet another large mineralization complex, Ilimaussaq, with the potential to produce both light and heavy rare earth products, more uranium and zinc concentrates, fluoride compounds and zirconium. I believe Greenland Mineral's go-slow approach and respectful partnership with the government and people of Greenland gives them the inside track for further successes. Further information is available on their excellent website, including pdf’s of all the maps, geologic charts, and photos you could possibly want to see.

There are a number of other small companies exploring for REEs and metals in Greenland but I think we’ll save them for a later time. This is enough to digest in one sitting!

The golden parabola

By Goldrunner

Gold is in an historic Bull Market because most nations are printing their paper currencies like they are going out of style (and maybe they are) as each nation tries to battle off the massive deflationary backdrop of debt that has permeated most of the world. This surge of debt monetization – this devaluing of the U.S. Dollar for one – has set the scene for a parabolic rise in $Gold to $1860, or higher, over the coming months before an intermediate-term correction takes place. Let me explain.

Just today, I read that the Fed has announced that they will buy back $97 Billion of Treasury debt next month which will be an increase in U.S. Dollar (Dollar) inflation next month akin to 25% of the $397 Billion the Fed has already done over the last 7 months since August. This is what the Fed calls QE II, pure debt monetization where new Dollars are printed up and used to buy back our Nation’s debt. This is pure Dollar inflation that devalues the Dollar by aggressively increasing the Dollar supply.

This surge of debt monetization by the Fed comes with $Gold having suffered a rather mild correction up at all-time highs. Overall, the Parabolic rise in $Gold appears to be accelerating on the chart as the corrections appear to be getting shorter in time and more shallow in terms of price. This is how a parabolic rise takes place. This also shows how the psychology of investors is changing toward $Gold. The price of Gold slurs and chops higher on the chart as investors’ fear of the supply of Dollars being printed keeps on rising. U.S. investors are increasingly becoming concerned about how the increasing supply of Dollars is devaluing the Dollar affecting everything in their lives – the buying power of their income, the stability of their jobs, the worth of their possessions, and of the value of their savings.

The US Dollar Index does not accurately track the devaluation of the Dollar
I find it fascinating to watch the Dollar Devaluation and the Gold Parabola play out. It is a continuing sketch of denial turning into reality. The Gold Bull is climbing very similarly to how it climbed in the late 70’s. Investors seem to primarily be watching the Dollar Index in an attempt to track the devaluation of the Dollar. Unfortunately, that simply will not work in an environment where most nations are aggressively printing their paper currencies. It did not work in the late 70’s, either.

When most countries are aggressively printing their paper currencies, a period of Global Competitive Currency Devaluations, the Dollar is being measured in the Dollar Index against a basket of other currencies that are also constantly falling in value. You cannot use a reference point that is constantly falling to determine the Dollar’s value because it negates the reason for a reference point in the first place. Thus, the Dollar Index is simply a “pricing mechanism” measuring the Dollar against other paper currencies that are falling in value. The Dollar “pricing index” becomes worthless as a gauge of U.S. “Dollar Value” in these times, just like it did back in the late 70’s.

The $Gold Chart is the only true comparison of Dollar value
The only true reference point of value for the Dollar at this time is a comparison to Gold. Thus, the $Gold chart is that only true comparison of Dollar Value as it is viewed in a ratio to relative constant value Gold once Global Competitive Currency Devaluations are ongoing. Smart money knows this so to a large extent the rise in the parabolic Gold Bull feeds on itself. Yet, the psychology that drives Gold higher is constantly fed by the fundamental facts of Dollar supply expansion such as the Fed’s recent announcement that debt monetization will be ratcheted up next month.

At a very similar point to today in the 70’s Gold Bull chart, Gold accelerated to the upside very sharply out of a similar bottom. The 1970’s move rose up to a point about 30% higher than the “last high.” If we see the same rise over the coming months a 30% rise would take $Gold up to around $1,860. Yet, there are different ways of arriving at a potential target, and some of them suggest a potential for Gold to rise over the coming months to an even higher target before an intermediate-term correction takes place.

A look at the weekly arithmetic chart of $Gold
The recent correction in gold fell a bit lower than I had expected. Although the chart of Gold has been playing out very similarly to the late 70’s Gold parabola, many of the corrections have been a bit deeper in the current period than those similar points in the 70’s Bull. I think that is to be expected. Investors have been constantly hampered by the confusion a deflationary backdrop provides versus the inflationary backdrop of the late 70’s.

Yet, it is not the backdrop that is driving the price of $Gold ever-higher. What is driving the price of $Gold ever-higher is the Dollar Inflation in response to the massive deflationary backdrop and deteriorating economy. The worse the debt levels and the worse the economy deteriorates; the more Dollar inflation is applied, fueling the $Gold Bull in its parabolic climb.

The $Gold has risen up out of the top of what I call “The Wave III Channel”, much like it did back in 2006 out of the “Wave I Channel.” Also, like in 2006, $Gold has corrected back to, and a bit below, the corresponding channel top. $Gold found a bottom at the red uptrend line off of the late 2008 Deflation Scare bottom. At the present time Gold has found a bit of resistance back up at the green line representing the “Wave III Channel Top.” If $Gold breaks through that green line as new Dollar Inflation accelerates into next month, I would expect the price of $Gold to resolve sharply to the upside similarly to the sharp move higher back in the late 70’s as described, above.

Note in the chart the sharp expansion in channel width between the “Wave I Channel” and “The Wave III Channel.” I would expect the price rise into the future to see a similar expansion of “The Wave V” channel defined by the red lines. This is how a parabola grows on an arithmetic chart. Also note how $Gold appears to have bottomed while the RSI reached the 50 line, and the Stochastic indicator turned up.

A look at the weekly log chart of $Gold
In the weekly log chart of $Gold showing the potential bottom in place we can see that for the last year, or so, $Gold has tended to bottom with the price dropping below the Bollinger Band mid-line down to touch the 34 week exponential moving average. Then, $Gold rises back up to and above the Bollinger Band mid-line. At each former bottom marked by green arrows on the chart, we can see that the RSI bottomed around the 50 mark while the Stochastic indicator turned up below the 50 line. This is classic bull market behavior at bottoms. We can also see that the MACD histogram has now bottomed- a precursor to the MACD turning up.

The ongoing Dollar devaluation Is driving the $Gold Price
If the late 70’s continues to be a good template for the current Golden Parabola that is unfolding, we have a lot higher for $Gold to rise. To be in the Precious Metals sector at this time I think it is imperative to seek out the correct Dollar valuation metrics since it is the ongoing Dollar Devaluation that is driving the $Gold price. Other issues like the massive deflationary backdrop and the deteriorating economy are the reason the massive Dollar Inflation program is being provided. False “pricing mechanisms” like the Dollar Index can be useful at times, but cannot be depended upon if one is seeking the true Dollar Devaluation that is occurring. For instance, from this current juncture in the late 70′s the Dollar was devalued a further 60% or so against Gold while the Dollar index fell only a fraction of that amount.

Diminishing effects of QE II by June will result in an intermediate-term gold correction
I believe the Fed has already given us the basic timing for this run in $Gold to meet an intermediate-term correction. When the Fed announced QE II they said that it would run into early June of this year. Since it is Dollar inflation/ Dollar Devaluation in the form of QE II that is now driving the $Gold parabola, it certainly makes sense that the end of QE II would invite an intermediate-term correction in $Gold. That being said, what we do not know for sure is just how much monetization the Fed will actually provide into June. Look at the Fed providing “guidance” as to how much debt they will monetize next month. They are practically begging the markets, including the PM sector, to rise by providing such guidance.

The Fed desperately needs Dollar Inflation to lead to price inflation to counteract the massive deflationary backdrop that exists. Debt monetization as a form of Dollar Inflation is mostly directed at devaluing the Dollar since very little of this form of Dollar Inflation actually enters the economy. Thus, we can count on further economic deterioration to lead to more Dollar Devaluation into the future.

The prospects for $Silver and the HUI
The prospects for $Silver going forward look to be just as promising, or even more promising, than our expectations for $Gold. Gold in Rand is now hitting the top of its ascending triangle for the 4th time, and the chart of $Gold suggests that Gold in Rand will likely be successful in terms of a break-out to the upside very soon. I will try to return shortly to show our expectations for $Silver, Gold in Rand, and for the PM Stock Indices.

Continue reading this article >>

Where Is Gold Headed?

By Brad Zigler
For some investors, the headline question is a forgone conclusion. For others, gold's price destination isn't so certain. Answering the question in great part depends upon one's time horizon.

Traders tend to have short - or shorter - investment horizons. That's not to say that they may not hold gold core positions for the long term. Many do, while they trade in and out of gold to capture intermediate- or short-term price trends.

Traders also have a choice of currency in which to trade. Bullion's gains and losses can be levered by trading in sterling, Swiss francs, euro or yen instead of U.S. dollars.

Gold's longer-term price track has been upward in all the reserve currencies since the launch of the euro in 1999, although the average rate of appreciation varies. You would, for instance, have earned the best average return if you'd bought your gold in sterling; less if your original purchase was in Swiss francs.
Gold Price (Jan. 1, 1999 to Feb. 16, 2011)
Currency
Average Annual
Return
USD
14.6%
GBP
14.8%
EUR
13.1%
JPY
11.6%
CHF
11.1%
There were plenty of peaks and valleys, however, that one could have traded as gold worked its way higher (or, from another viewpoint, as currencies worked lower). For example, gold appreciated at a higher rate against the euro early in the currency's career. Then, as its appreciation against the euro dipped, gold began trading higher against the greenback and the pound:
Gold Price Since 1999
Over the past couple of years, there's been a lot of volatility in bullion's price across the forex market. Notice, in particular, the reversal of the euro's fortunes compared to the Swissie and yen.
Recent Gold Price Trend
Currency
2009
Return
2010
Return
USD
25.0%
29.0%
GBP
22.9%
32.8%
EUR
13.6%
39.5%
JPY
25.6%
14.0%
CHF
22.9%
16.9%
Viewed from a peculiar perspective, the U.S. dollar seems almost stable. Or at least its rate of degradation against gold has been more consistent.

And now? How has gold fared against the major currencies in 2011?

Gold lost ground against all the reserves early on, but by varying degrees. Generally, 2010's year-end downtrend carried over through January. But now we're seeing the signs of a rebound.

Gold has bounced the most in Japanese yen, now trading above - albeit by just 0.5% - its New Year's Day price. Meanwhile, it has been weakest against the euro, down 6.5% since the top of the year. Still, that's an improvement from its 9.5% dip earlier this month.

Gold's track record in dollars has been, for lack of a better word, middling. It didn't fall as much as some other currencies, but it didn't - or hasn't yet - rebounded as much as others, either. In dollar terms, bullion remains 2.6% underwater for the year:
Gold Price In 2011
Gold Price In 2011
We're now at a point where gold prices are likely to stage a sustainable rally; that is, if certain resistance points are taken out. The most critical point, in dollars, is $1,393/oz. Decisive closes above this mid-January high in spot prices could set the stage for bullion to take out its former highs.

So, just how high is high? Well, if the stars align rightly - or more appropriately, if the fear index continues to be cranked up by doings in the Mideast - that could mean $1,478/oz.

It's likely to be a short throw, too. If we get a breakout move immediately, it might take just a month or so.

(For GLD investors, the breakout level would be $135.70 with an objective of $143.50.)

The more interesting question is where gold goes from there. Will this be just another stair-step to yet higher prices, or will this be the final thrust that finishes the gold bull off? A bit of fog still remains in our crystal ball, but we'll be sure to let you know when it starts to clear.

We'll look at the implications for other currency/gold cross rates in the coming week.

Continue reading this article >>

Fed QE2 Inflation Fuels Global Fury and Rage


The Federal Reserve has been busy the last three months pumping up the money supply by $300 billion dollars, with much more promised in the months ahead. Some of the results have been painfully predictable, others less so.

Fed chairman Ben Bernanke said he did this to stimulate housing and employment. The unemployment rate has fallen in recent months, but most market analysts are skeptical that the statistical improvement is real or lasting.

The headline numbers on housing also appear good, with building permits increasing 16.7 percent in December. However, units actually "currently under construction" came down by the same amount, 16.7 percent. Housing starts decreased in December by 4 percent and starts of single-family homes were down by 9 percent.

Even the improvement in building permits indicates continuing trouble. The increase in permits occurred mostly in the Northeast and West, and the bulk of the increase was for multiunit structures (i.e., apartments and duplexes). This makes sense, given that people are losing their homes or downsizing into apartments due to budget constraints.

Also, the number of permits issued in December 2010 was 7 percent less than in December of 2009. Likewise, housing starts were 8 percent lower this December than in the previous year.

One factor weighing on the housing market was interest rates. Mortgage rates have started to increase along with bond yields. Presumably, Mr. Bernanke thought QE2 would have reduced mortgage rates, but he recently testified to Congress that the new higher rates are actually a sign of "green shoots" in the economy. Higher rates could be a sign of economic confidence, but other signs indicate lenders are concerned about inflation and are raising rates to account for the falling value of the dollar.

The price of everything seems to have skyrocketed. Only housing, the dollar, and inflation-adjusted income are negative. World food and commodity prices are up 28 percent over the last 6 months. The MIT "Billion Prices Project" confirms that prices have been surging higher than indicated by the consumer price index. Entrepreneurs tell me that big price increases are already planned for everything from vegetables to blue jeans.

Higher food prices set off the revolutions in Tunisia and Egypt and the mass protests in countries like Algeria, Jordan, Yemen, Bahrain, and Iran. People in these countries buy more unprocessed foods and spend a much higher percentage of their income on food, so they have been severely impoverished by Bernanke's QE2.

Bernanke claims that monetary policy cannot change the quantity of wheat by one bushel and that higher food prices are the result of bad weather conditions in Russia and Australia. However, bad weather does not explain why the prices of virtually all food and nonfood commodities have increased substantially in recent recessionary times. This is clearly a case of too much money chasing too few goods.

Of course, it would be incorrect to credit Bernanke for freeing the Egyptian people, because food prices were only the trigger, not the true cause of all this social unrest.

However, it is surely correct to credit Bernanke and his fellow central bankers for worldwide commodity inflation.

Gold and Silver Bullion Bottleneck or Supply Deficit?


Jeff Clark, BIG GOLD writes: There have been numerous reports of bullion shortages in many parts around the world, along with rising premiums. And the two explanations - we're running out of gold! and, it's just a manufacturing bottleneck - are at odds with one another. So, who's right?

First, the data. The following has been reported since New Year's eve horn-blowers were put away:
  1. Report from China: "...premiums for gold bars jumped to their highest level in two years."
  2. A director at Cheong Gold Dealers in Hong Kong: "I don't have any gold. Premiums are very high. Some say they have no stocks on hand."
  3. A dealer in Singapore: "There's a sudden surge in demand. Demand from China is very strong and they are paying very high premiums. Refiners can't meet the demand."
  4. World Gold Council report: "...gold imports by India likely reached a record last year due to increased investment demand. Imports will probably be the highest for India in its history."
  5. Nigel Moffatt, treasurer of the Perth Mint: "...demand for gold bullion has been unrelenting since gold dropped below $1,400 an ounce. At the moment demand is such that we cannot meet all the enquiries we are getting. Demand for our coins and medallions is strong, but the biggest demand is coming from banks and traders looking for kilo bars."
  6. Eric Sprott, chief investment officer of Sprott Asset Management, after having difficulty locating enough bullion for their new silver fund: "Frankly, we are concerned about the illiquidity in the physical silver market. We believe the delays involved in the delivery of physical silver to the Trust highlight the disconnect that exists between the paper and physical markets for silver."
  7. 2010 gold Buffalo coins are largely unavailable from dealers.
  8. Sales of silver Eagles set a new record in January - by the 19th of the month. Already, 4.6 million coins have been sold, an all-time monthly high since the coin's release in 1986.
Based on this data alone, you might come to the conclusion that yes, we're running low on bullion supply. But most industry execs I spoke to insist this is a "bottleneck" issue: current demand is greater than current stock on hand, or is coming in faster than mints can produce. In other words, it's a fabrication issue, not a supply deficit. A Treasury rep said as much.
You'll recall from 2008 how supply was difficult to come by and premiums were roughly double what they are now. Some think it will be "lesson learned" this time around; mints now know how to prepare for another spike in demand. Many have added workers, shifts, and facilities. The U.S. Mint stopped producing the less popular coins and now focuses on those that are most in demand.
To a large extent, I believe the bottleneck argument is exactly what's happening. It's no different than the store that sells old-fashioned wooden rocking chairs suddenly getting swamped with customers when an antique dealer declares they'll be valuable collectibles in the future. Collectors rush to buy, and the store doesn't have enough rocking chairs in its warehouse. But they're not running out of wood. And they'll likely be better prepared when they hear the dealer is coming out with a book.
It's true there's only so much gold coming to market every year (total 2010 supply is estimated to have been about 115 million ounces), but in the big picture, there's been enough. It's also true that orders from the 2008 rush were eventually filled. However, I think the "bottleneck" and "we're running out" arguments miss the point, because they both focus on supply.
Demand is what I'm concerned about. Now try this data:
  1. According to International Strategy and Investment Group, gold ownership currently represents 0.6% of total financial assets. If it rose to just 1.2% - still less than half its 1980 level - it would require an additional 917.1 million ounces, or 16% of aggregate gold worldwide. This amount is equal to about 10 years of current global production.
  2. Investment demand represented 53% of all gold demand in 1979; today, it represents just 32%. Coin demand represented 37% of all demand in 1979; today it's less than 14%.
  3. Gold and gold mining stocks represented 26% of all global assets in 1981 (high inflation), and 20% in 1932 (high deflation). Today, gold and gold mining shares represent about 1% of global assets.
  4. The market cap of the entire gold industry is about the size of Microsoft, is less than Exxon Mobil, and is 10 times smaller than the banking industry. The whole of the silver industry is smaller than Starbucks.
  5. Silver mine production is insufficient to meet current demand. The only way silver needs are fulfilled is from scrap coming to market. Miners don't produce enough on their own.
  6. There are approximately 40% more earthlings right now than there are ounces of gold that have ever been mined. That includes every ounce used in jewelry, electronics, and dental. Further, if every ounce of supply last year were made into coins and bars for investment purchase, it would amount to less than two one-hundredths of an ounce, or about half a gram, for every man, woman, and child on earth. This means 0.018% of the global population - about one in every 55 people - could buy a one-ounce gold coin this year.
Yes, there is a bottleneck. But with this recent spike in demand, it appears some mints still aren't equipped to keep up. Are we nearing a tipping point where in spite of the increased efficiency and preparedness, requests from buyers will outweigh available supply? Imagine demand continuing to accelerate, and you can see where this might be headed. I think this is the side of the equation to watch.
Andy Schectman of bullion dealer Miles Franklin told me last summer that, "Based on what I know, it's my opinion that if 5% of this country put 5% of their money into gold, there would be nothing left tomorrow morning." In other words, even if supply is sufficient at present, what happens if demand, say, doubles, as the above data show is possible?
Right now in North America you can still get bullion, but we're clearly on a path where demand could overwhelm the system, making purchases very difficult. When that point arrives, many investors will wish they hadn't worried so much about price.
Imagine Doug Casey is right about the future value of the dollar: zero. Imagine how high inflation would rocket in such a scenario.
Bottleneck, meet desperation.
The Chinese and other governments are gobbling up gold as fast as they can, adding vast amounts to their already large holdings. Because they know something many mainstream investors don’t: the U.S. dollar is on its last leg. To find out how to protect yourself – and to profit – watch this free video.

Follow Us