Sunday, February 8, 2015

Post-Crisis Scorecard: Debt Up $57 Trillion, 60% Of Jobs Created Are Low Level, Record Youth Living With Parents

by Michael Krieger

On Friday, my Twitter stream was filled with some of the most outlandish bullish economic victory laps from pundits I’ve ever seen. The source was the monthly employment report, which showed a larger than expected increase in employment as well as higher wages. In addition, there was a huge upward revision to employment data in November. Interestingly enough, on the same day this report was released, several important articles came across my screen that make me as concerned as ever about the true state of the economy and where we are headed.

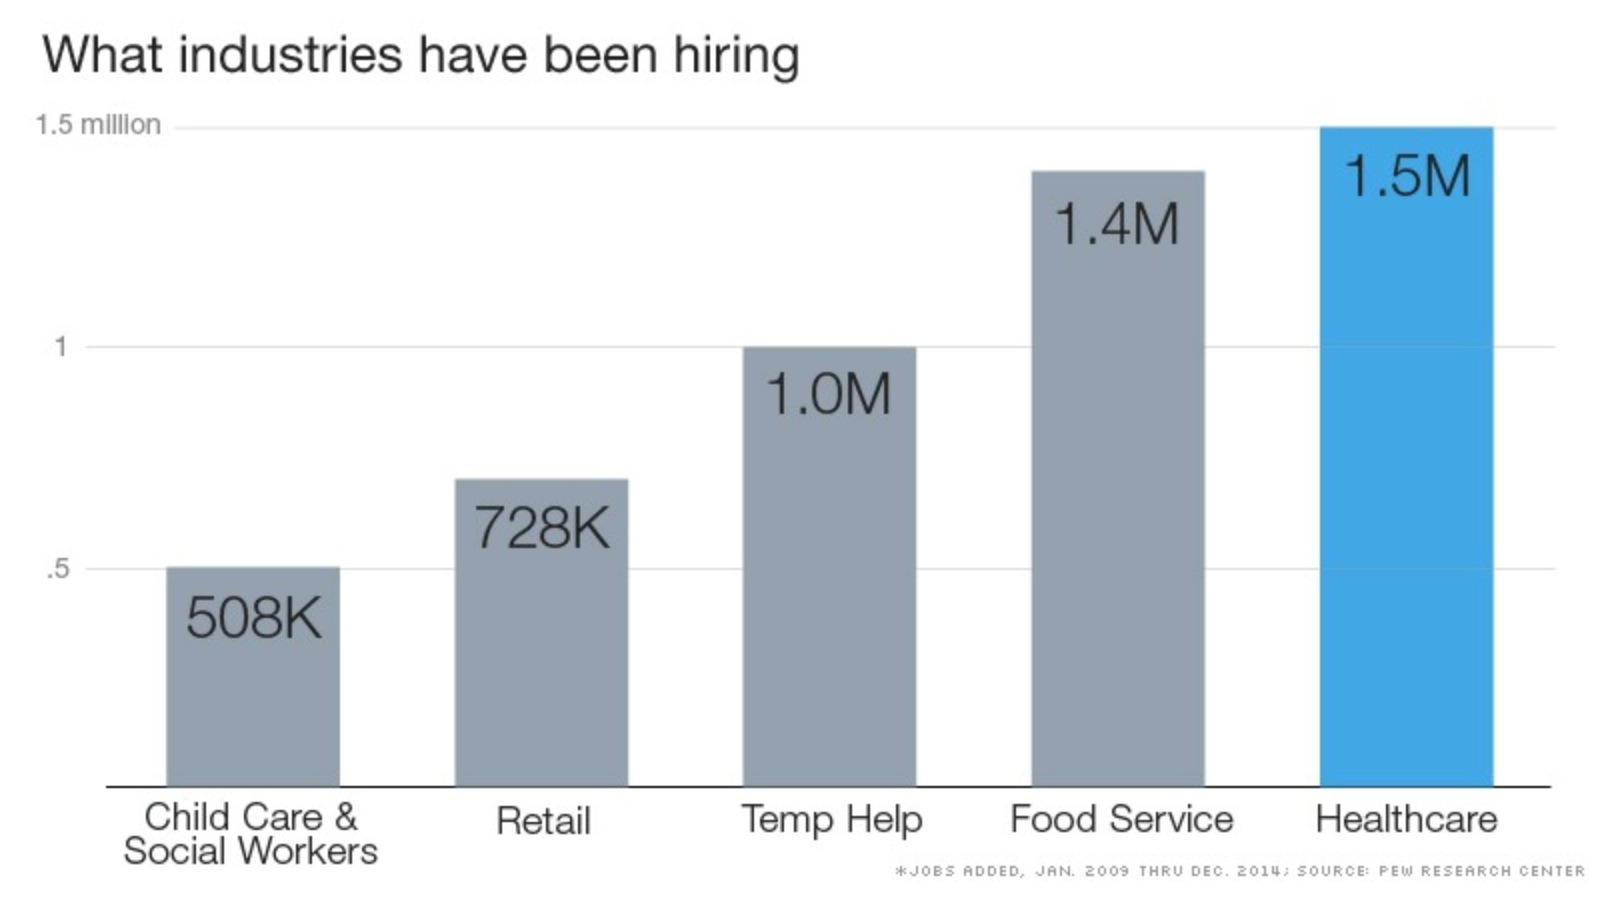
First, CNN Money just yesterday published an article titled: Obama Jobs: More Caregivers, Servers and Temps. Here are a few excerpts:

Got a job while Obama was president? Then there’s a good chance you are working in healthcare or food service or as a temp.

Those sectors were responsible more than 60% of the jobs created since Obama took office in January 2009.

Healthcare now employs 14.9 million Americans, up 11% over the past six years, according to a recent Pew Research Center report. More than one in 10 payroll jobs in the U.S. are in this industry.

Much of the job growth in healthcare has taken place in home health care services and outpatient care. That follows both the aging of America and the shift away from more costly hospital and nursing home care. These later two industries added only 3.7% and 1.2% more jobs, respectively, since 2009.

Meanwhile, bars, restaurants and other food-service employers have also been adding to their payrolls. More than 10.8 million people now work in this industry, up 14.6% over the past six years.

And temporary help agencies saw their employment soar 52.5% during the Obama administration to just under 3 million.

Here’s a chart:

Screen Shot 2015-02-06 at 10.47.46 AM

For concerning story number two, I turn your attention to a New York Times article titled: Global Debt Has Risen by $57 Trillion Since the Financial Crisis, Which Is Scary. Here are a few excerpts:

Here are two things we know about how debt affects the economy.

First, in the abstract it doesn’t matter. For every debtor there is a creditor, and in theory an economy should be able to hum along just fine whether a country’s citizens have a great deal of debt or none. A company’s ability to produce things depends on the workers and machines it employs, not the composition of its balance sheet, and the same can be said of nations.

Second, in practice this is completely wrong, and debt plays an outsize role in creating boom-bust cycles across the world and through history. High debt increases the amplitude of economic swings. To think of it in terms of the corporate metaphor, high reliance on borrowed money may not affect a company’s level of output in theory, but makes it a great deal more vulnerable to bankruptcy.

That’s what makes a new report from McKinsey, the global consulting firm, sobering. Researchers compiled data on the full range of debt that countries owe — not just their governments, but corporations, banks and households as well. The results: Since the start of the global financial crisis at the end of 2007, the total debt worldwide has risen by $57 trillion, rising to 286 percent of global economic output from 269 percent.

So far, the Chinese government has skillfully managed a slowdown in economic growth and signs of a housing boom reaching its end, but whether it will be able to avoid a sharper correction is one of the great questions hanging over the global economy.

How skillfully has it really managed the slowdown? It feels as if every other day I see stories about increased authoritarianism and new internet crackdown measures. I think China is way more politically vulnerable than people recognize.

Meanwhile, the McKinsey report can be read as giving a largely positive assessment of the United States. While total debt for the real economy is up by 16 percentage points in the United States, to 233 percent of G.D.P., household debt is actually down by 18 percentage points and corporate debt by 2 percentage points. A rise in public debt since 2007, in other words, largely offset declines in private-sector debt.

Still, if you accept our starting premise — that high debt, whether public or private, makes economies more vulnerable to economic shocks and tends to fuel booms and busts — the report offers plenty to worry about.

But the solutions they offer are big policy changes that would happen only glacially. The reality that economic policy makers around the world must grapple with, especially those in China and Japan, is that eight years after a financial crisis brought on by high debt, we may not have learned as much as we would like to think we have.

However, what is most disturbing about the above when it comes to the United States, is that more than half a decade after a crisis fueled partly by questionable debt considered AAA, U.S. debt to GDP is up 16 percentage points to 233% of GDP.It is well known that much of the increase in public debt has been the result of trying to prop up the economy. Yet we just learned that 60% of the new jobs created since 2009 have been of very low quality. Recall that “temporary help agencies saw their employment soar 52.5% during the Obama administration to just under 3 million.” What do you think things are going to look like during the next cyclical downturn?

Finally, we arrive at the following related article of the day. This one is from Bloomberg and titled: The Simple Reason Millennials Aren’t Moving Out Of Their Parents’ Homes: They’re Crushed By Debt. Here are a few excerpts:

The share of young men and women living with their parents rose to a record last year

Millennials are not budging from their parents’ basements, even though the job market is on the mend. One really big reason? Student loans.

Last year, the rate of 25- to 34-year-olds living at home rose to 17.7 percent among men and 11.7 percent for women, Census data showed last week. That is a record high for both genders.

To make things even worse, a super-hot housing market is making it too expensive for even gainfully employed millennials to get their own place.

“Strengthening youth labor markets support moves away from home, but rising local house prices send independent youth back to parents,” the report said.

There’s so much important information in this short article it’s incredible. First, the piece blames the living in basement phenomenon on debt levels. What happened to the notion that debt doesn’t matter?

I’d add that an equally important factor is that most of the jobs created in the Obama years have been menial, low paying jobs. As I highlighted earlier.

The last point though is the most interesting. It notes that “a super-hot housing market is making it too expensive for even gainfully employed millennials to get their own place.”

This is quite bizarre, since it is millennials themselves who should be driving the housing market. That would be the case if the entire public policy response post-2008 was anything more than an oligarch bailout.

An unbiased observer can plainly see that the entire post-crisis response has been to do “whatever it takes” to protect the power, prestige and wealth of politicians, central bankers, Wall Street, and the super rich. It was a leveraged bailout of the status quo. It certainly hasn’t succeeded at all in fostering a healthy free-market economy.

The results speak for themselves, and funneling even more money to oligarchs isn’t going to change the situation.

See the original article >>

What Looks Crazy at First Might Be the Ideal Solution: Meet Greece's New Currency, the U.S. Dollar

by Charles Hugh Smith

There is an undeniable internal logic to the idea that Greece should jettison the euro and adopt the U.S. dollar as its national currency.


Several astute readers pointed out that for Greece to renounce the euro and transition to a newly issued national currency (drachma) is fraught with numerous structural difficulties. It is not easy to issue and distribute enough new currency to grease commerce from a standing start.

This was response to Greece: Are You Finally Ready to Do the Right Thing and Leave the Euro? (February 6, 2015).

Since adopting a new drachma is problematic, the obvious solution (at least to me) is for Greece to follow the example of other countries with currency crises and adopt the U.S. dollar as its national currency.


Before you dismiss the idea out of hand, hear me out. It might not be as crazy as it seems on first blush.

Here is a straightforward three-point plan to set Greece on a sustainable, positive pathway. But before we can understand how the plan resolves Greece's no-win situation (yet another Kobayashi Maru scenario), we first need to understand very clearly why the euro currency failed.

I have covered this many times before:

Why The European Union Is Doomed (March 28, 2011)

Why the Eurozone and the Euro Are Both Doomed (June 23, 2011)

Three More Reasons the Eurozone Is Doomed (September 22, 2011)

Yet Another Reason Why the Euro Is Doomed (October 17, 2011)

If we had to distill the dynamic down to a single paragraph, it would be this: By accepting the "strong currency" euro that was supported by promises of fiscal prudence, Greece and the other weaker economies of Europe artificially inflated the credit market's willingness to lend them money. At the same time, the euro also lowered the cost of goods from Germany by eliminating the labor-cost arbitrage of currencies.

I know this may sound complicated, but we can grasp the core dynamics using household analogies.

The willingness of lenders to lend and the rate of interest they charge is based on economic fundamentals: the balance sheet of assets and liabilities, and cash flow: how much income goes to pay liabilities and how much is left over as surplus to spend or invest.

Households and nations with weak balance sheets (i.e. liabilities exceed assets) and weak cash flow balances (i.e. much of the nation's income is already committed to entitlements and liabilities, so relatively little is left to fund future borrowing) will find it difficult to borrow a lot, and the rate of interest they will pay will be high.

Nations have another mechanism to differentiate between strong and weak balance sheets: national currencies. Countries with weak cash flow and risky balance sheets will have weak currencies, as people price the risk into the currency.

In effect, Greece was like the poorer brother who suddenly got the wealthier sibling's credit card. In this sense, the euro was a scam, because it stripped the market of the pricing mechanism that we call currencies. By pricing all money the same regardless of national balance sheets and cash flows, then weaker countries got the credit card of their stronger brethren.

Predictably, these nations over-borrowed. When presented with the opportunity to borrow huge sums at low rates of interest, it is "rational" to accept the opportunity.

Who benefited from this elimination of market pricing via currencies? Germany and the banks. In pre-euro days, it took a lot of Greek drachmas to buy expensive goods from Germany. After the euro was introduced, German goods became cheaper in terms of hours worked and interest rates paid.

German exports to the rest of Europe have been strong, and these exports within Europe are the backbone of the German economy. (Exports are roughly 40% of the German economy, the highest in the world for major economies. Exports make up about 10% to 15% of the economies of Japan and the U.S.)

The pool of apparently creditworthy borrowers expanded greatly, and the banks promptly began lending vast sums to both the public and private sectors of these fundamentally weaker nations.

You can't fool Mother Nature with artificial games for long, and now reality has trumped artifice: the nations with weak balance sheets and cash flows cannot support the monumental debts they acquired during the decade of the euro-scam.

If you eliminate the market's ability to price risk and credit, the market breaks down. That is the eurozone in a nutshell.

The no-win situation is clear: if it wants to continue using the euro, Greece must pay its debt and interest in euros. Its economy simply isn't large enough or productive enough to do this, so that's simply not possible. Wishing it were possible doesn't make it possible.

As a result, the weaker, over-indebted nations are in death-spirals of higher taxes and higher debt servicing costs. Each bleeds vitality and trust from the economy, driving it deeper into fatal contraction.

These nations are also in political death spirals. I spoke at length with a well-informed young Greek friend who has lived in both Germany and the U.S., so he is well-acquainted with the perspectives of Germans and Americans.

He reports that the Greek people are profoundly divided on the question of whether to stay in the eurozone or risk leaving it. He said that even within the various political parties, there are two camps. In his opinion, the odds of either camp surrendering their deeply held beliefs and fears is very very low. Those who want to stay in the euro are terrified that a return to the drachma would wipe out the nation's savings and further reduce the already diminished incomes of households: in effect, the middle class would be wiped out.

Others see a deeply sinister master plan in all this: pushing Greece back to the drachma would immediately render the nation poorer and make its assets very cheap to foreign Elites, who would rush in and snap up Greek assets at fire-sale prices. Greeks would lose their country.

This is indeed part of the dynamic when nations radically devalue their currency: if a villa in Greece was 300,000 euros before the return to the drachma, it might be only 100,000 euros when the drachma is re-instated. Priced in euros, the whole of Greece would "go on sale".

I hope you can see that there are two parallel no-win situations here, a financial one and a political one. This is the Kobayashi Maru scenario on a national scale, and there is no exit if you stay within the rules of the game: euro or drachma, etc.

Here's my "crazy idea that's not so crazy if you think it through": Greece should adopt the U.S. dollar as its currency while renouncing all debt denominated in euros. I don't mean a "haircut," I mean billiard-ball bald: 100% of all debt denominated in euros would be renounced. Not one euro will be repaid.

The reason is that the banks (lenders) knew darn well that Greece remained a weak economy, and eliminating the currency arbitrage by accepting the euro did not magically strengthen Greece's financial fundamentals. It was all a scam that the banks exploited, including the European Central Bank, and so they will have to accept the losses now that the scam has collapsed.

Nobody put a gun to the head of lenders who fronted Greece stupendous sums of money at low rates of interest. It was their gamble and they lost. End of story.

Whatever else you can say about the U.S. dollar, it retains global trust as a medium of exchange and a transparent store of value. Your $100 bill is good in Laos, Bolivia, Russia, China and everywhere else. Its value fluctuates because the market is free to set the risk of holding dollars.

Ultimately, all fiat currencies are simply physical measures of trust. People know the U.S. has plentiful problems of its own, but they also know the problems are well-known and transparent to all, so the market can price risk in the dollar. They also know the U.S. isn't going away tomorrow, and that there are enough dollars floating around the globe that there will always be someone who will accept the dollars in trade for tangible goods at a transparent price.

The problem with returning to the drachma is the risk of the transfer is unknown, and so the risk will be transferred to the drachma. By making the process into two steps--exit the euro for the dollar, then later, if the Greek people choose to, exit the dollar for the drachma--the risk and distrust is removed from the initial step of exiting the euro.

The compelling logic of moving one's cash out of Greece--capital flight--disappears once people's euros become dollars.

Here's the beauty of Greece accepting the dollar: since Greece cannot print dollars, then everyone will know the currency cannot be depreciated by the Greek state. If Greece can print drachmas in unlimited quantities, then the drachma will quickly lose whatever value it begins with. In contrast, regardless of the policies of the state or central bank of Greece, the dollar will still have the same value day to day.

All euros in accounts would convert to dollars.

This will immediately restore trust and trade, both domestically and internationally, as everyone will know the U.S. dollar will retain its value everywhere.

Does Greece need U.S. approval to take the dollar as its interim currency? No--the dollar is ubiquitous and in sufficient quantity that there are enough physical dollars floating around the world to serve as the currency for a small nation such as Greece. (Consider that the USD is already the currency of Panama, El Salvador and Ecuador.)

The third critical step in my plan is that Greece must reach a political consensus on taxation and governance. Everyone knows that tax avoidance has undermined the Greek state's finances, and the people of a democracy have to reach a consensus themselves: it cannot be imposed by bureaucrats from afar.

The State needs enough income to do what the people want it to do, and so everyone is going to have to pay taxes. Those who evade will have to be shunned/coerced by public opinion into compliance, for the national good. The institutions of taxation will have to restore trust in their fairness and transparency.

Greece must have a transparent national dialog on taxation and governance, and reach a consensus via the democratic process. Without this step, then it won't matter what currency Greece uses, it will slip further into a death-spiral of dysfunction.

So here is the 3-point plan:


1. Renounce all debts denominated in the euro, i.e. a 100% writedown.

2. Accept the U.S. dollar as the national currency of Greece.

3. Engage in a transparent national dialog and reach a consensus about taxation and the role of the state in the Greek society and economy.

We might add a fourth point: renounce scams and kicking problems down the road rather than addressing them directly, sweeping dysfunction under the rug, etc.

There is a compelling internal logic to Greece adopting the US dollar as its currency: when trust in national currencies and institutions is lost, then the black market becomes the trustworthy place to engage in trade. The world's favorite black market currency is of course the U.S. dollar. In this sense, for Greece to officially accept the U.S. dollar as its currency is simply a recognition of the natural progression from a currency that is no longer viable to one that is.

See the original article >>

Weighing the Week Ahead: Time for “Risk On?”

by oldprof

With a modest schedule of data releases, we can expect more analysis of last week’s news. Trading in several markets changed course rather abruptly. With traders poised to spot any change in trend, the question will be whether this shift is for real.

Is it finally time for “Risk On”?

Prior Theme Recap

In last week’s WTWA I predicted that the deluge of economic data would be closely examined for signs of weakness. Put another way, would the economic releases confirm the story of the markets in commodities and bonds? The question was a good one, and the answer was “no.” Friday’s employment report was the final element, changing the terms of the debate from deflation concerns to that old standby, worrying about the Fed.

Feel free to join in my exercise in thinking about the upcoming theme. We would all like to know the direction of the market in advance. Good luck with that! Second best is planning what to look for and how to react. That is the purpose of considering possible themes for the week ahead.

This Week’s Theme

The quirks of the calendar sometimes result in a quiet week following one crammed with data releases. Such is the case in the week ahead, but there is plenty of food for thought. Strength in oil, commodities, and stocks combined with weakness in bonds, utilities and even the dollar. It was the first 2015 sign of a change in market tone. Traders were asking: Is it time for “Risk On?”

Background

Over the last two months I have carefully raised and explored the “message” from various markets.

These themes all gave due respect to the approach of seeking a “message from the market.” This is a favorite for most traders and pundits, but it often serves to explain the past. Few seem to find predictive edge from this approach, although it sounds good on TV.

The alternative is to use economic data and corporate earnings to discover where markets may not be efficient. This helps to identify sectors and stocks that are mispriced. Last week I suggested that it might be time to start with the economic data rather than market prices. This advice echoed my 2015 Annual Preview.

The Viewpoints

Here are the main contenders:

  • Trader perspective – markets lead. Brett Steenbarger started the week with his explanation of weakness in five macro themes. In the old days when he lived in Naperville, we would have a cup of coffee to argue it out. I miss those conversations. By week’s end he acknowledged that a “savvy trader” had to be alive to changes in market themes.
  • Trader perspective – agility. Charles Kirk’s indispensable weekly chart show (small subscription price required, and well worth it) notes that markets held support, “safety” trades could be quickly abandoned, and there was still a search for reasons to sell. Well put!
  • Improving economy. Check out the weekly analysis below. Also “Oil Near a Bottom?” And New Deal Democrat. NDD also has his valuable comprehensive summary of factors.
  • There is no hope. Some pundits cannot even discuss good news for a few minutes before turning to what this means for the Fed. You know it is politically charged commentary when it says the Fed is “running out of excuses.” A small change in the timing for the very first increase in short-term rates is heralded as a market disaster. This theme finds its way into the mainstream media, even including non-financial sources like the PBS Newshour.

The tone change was apparent in oil, bonds, utilities, and other markets. The trading in TNX is typical. This is a CBOE product that tracks the ten-year yield. Just divide by ten. Pick your own upside target for the first move.

TNX

And here is the same story told in utility trading – last year’s big winner and last week’s big loser.

xlu

As always, I have some additional ideas in today’s conclusion. But first, let us do our regular update of the last week’s news and data. Readers, especially those new to this series, will benefit from reading the background information.

Last Week’s Data

Each week I break down events into good and bad. Often there is “ugly” and on rare occasion something really good. My working definition of “good” has two components:

  1. The news is market-friendly. Our personal policy preferences are not relevant for this test. And especially – no politics.
  2. It is better than expectations.

The Good

Despite the market reaction, there was plenty of good news last week.

  • Rail traffic was strong. See Steven Hansen at GEI. Also note Bob Dieli in the quant corner on truck traffic. Skeptics of government data should be paying attention to verification from private sources.
  • Weekly jobless claims remained low. The 278K reading confirmed last week’s holiday data. Bespoke has the story and this chart:

020515 Initial Claims SA

  • Earnings reports have been positive. It may not seem like it, but 78% of reporting S&P companies have beaten on earnings and 58% on sales. (FactSet). Some readers objected last week that these results reflected success against lowered expectations. Of course. I have frequently written about this phenomenon. The question right now is whether estimates have fallen enough, and apparently they have. Brian Gilmartin has a more upbeat take, emphasizing the results outside of energy. If energy were to stabilize, potential would be even stronger. This is why it is right to take note of results, especially in the energy sector, where the news was pretty good this week.
  • Auto sales were strong versus easy comparisons from last winter. A feature was the rebound in the Ford F150 indicator. This has some correlation with small business and construction activity, but has recently been distorted by the model changeover. See Bespoke for the story and charts.
  • ISM services registered a slight beat of expectations at 56.7, maintaining former strong levels. (Doug Short).
  • Oil prices firmed. The long-term economic effects remain a subject for debate. Meanwhile, the short-term “risk on” correlation remains. James Stafford at Oilprice.com summarizes the economic and geopolitical factors behind this week’s trading.
  • Employment strengthened. Net payroll jobs increased as did wages and hours. Labor force participation was stronger. Prior months were revised higher. You had to look hard to find something wrong with this report, mostly factors that were improving less than the headline numbers. The WSJ has a full chart pack. Jon Hilsenrath goes quickly to the possible implications for Fed policy.

BN-GV541_annual_G_20150206085332

The Bad

The bad news included some significant economic reports.

  • Ukraine. There were European meetings without apparent progress, addressing the question of whether Ukraine supporters should provide more deadly weapons (as requested). A peaceful resolution and the winding down of sanctions would be a major plus for the world economy and also for equity markets. Since the negative impact has built up gradually, it is much greater than most realize. To be fully informed, you could start with the interesting Brookings debate.
  • The ISM index declined to 53.5 from 55.1, missing expectations. Some key internal factors also looked weak. Steven Hansen at GEI has a full account. I like his analysis since it includes detail on the component breakdown. As he notes, this is still expansion territory. The official ISM commentary has several references to the West Coast port issues and also notes that the data imply a GDP increase of 3.3%.

16142985ztemp

The Ugly

Measles? Libya again? Medical records hacking? Discussion welcome!

The Silver Bullet

I occasionally give the Silver Bullet award to someone who takes up an unpopular or thankless cause, doing the real work to demonstrate the facts.  Think of The Lone Ranger. No award this week, but nominations are welcome. I am seeing plenty of bad charts, but little refutation.

Quant Corner

Whether a trader or an investor, you need to understand risk. I monitor many quantitative reports and highlight the best methods in this weekly update. For more information on each source, check here.

Recent Expert Commentary on Recession Odds and Market Trends

Bob Dieli does a monthly update (subscription required) after the employment report and also a monthly overview analysis. He follows many concurrent indicators to supplement our featured “C Score.” This week’s report covers a range of important issues beyond the headlines, including interesting sections on part-time employment as well as important sectors. An example of important information you do not see elsewhere is the analysis of job growth in trucking, “…if there is nothing to put in the trailer, you don’t put anyone in the tractor.”

Dieli Truck Hiring

RecessionAlert: A variety of strong quantitative indicators for both economic and market analysis. While we feature the recession analysis, Dwaine also has a number of interesting market indicators.

Doug Short: An update of the regular ECRI analysis with a good history, commentary, detailed analysis and charts. If you are still listening to the ECRI (three years after their recession call), you should be reading this carefully. Doug has the latest interviews as well as discussion. Also see Doug’s Big Four summary of key indicators.

Georg Vrba: has developed an array of interesting systems. Check out his site for the full story. We especially like his unemployment rate recession indicator, confirming that there is no recession signal. Georg continues to develop new tools for market analysis and timing. Some investors will be interested in his recommendations for dynamic asset allocation of Vanguard funds and TIAA-CREF asset allocation. He has added a method for Vanguard Dividend Growth Funds. I am following his results and methods with great interest. You should, too. Georg’s update this week is a relative value bond indicator. Georg asks, “When Will the Panic Buying End“? Read the entire piece for the full interpretation behind this interesting chart:

bvr2-5-15

The Week Ahead

It is a modest week for economic data.

The “A List” includes the following:

  • Initial jobless claims (Th). The best concurrent news on employment trends, with emphasis on job losses.
  • Retail sales (Th). What will happen to the gasoline savings?
  • Michigan sentiment (F). Remains important for jobs and spending.

The “B List” includes the following:

  • JOLTs report (T). Most still do not understand the significance of this series – labor market slack. This is the factor watched by the Fed, not a backdoor method for estimating overall job creation.
  • Wholesale inventories (T). December data, but relevant for Q4 GDP.
  • Business inventories (Th). Same as wholesale data.
  • Crude oil inventories (W). Maintains recent interest and importance.

There is a little FedSpeak as well as appearances and meetings featuring world leaders. Important corporate earnings continue.

How to Use the Weekly Data Updates

In the WTWA series I try to share what I am thinking as I prepare for the coming week. I write each post as if I were speaking directly to one of my clients. Each client is different, so I have five different programs ranging from very conservative bond ladders to very aggressive trading programs. It is not a “one size fits all” approach.

To get the maximum benefit from my updates you need to have a self-assessment of your objectives. Are you most interested in preserving wealth? Or like most of us, do you still need to create wealth? How much risk is right for your temperament and circumstances?

My weekly insights often suggest a different course of action depending upon your objectives and time frames. They also accurately describe what I am doing in the programs I manage.

Insight for Traders

Felix continues a “neutral” posture for the three-week market forecast, but it continues to be a close call. The data have improved a bit, but are still marginally neutral. There is still plenty of uncertainty reflected by the high percentage of sectors in the penalty box. Our current position is still fully invested in three leading sectors, and we have gotten more aggressive. For more information, I have posted a further description — Meet Felix and Oscar. You can sign up for Felix’s weekly ratings updates via email to etf at newarc dot com.

Brett Steenbarger has typically wise advice for traders – thinking about trading as an entrepreneur would a new business. Great stuff.

A sadder note for many of us is the end of floor trading in many contracts at the Merc. The several Chicago floors at one time had over 10,000 traders. To be successful required a unique blend of spirit, fast thinking, intelligence, athleticism, integrity, and courage. You also had to be impervious to distractions like people spitting on you, poking you with a pencil, or getting in your face. Trades were cleared at the end of the day. If you did not honor a trade, you were soon gone.

Craig Pirrong has a great account of this change, historic but inevitable. Follow his links to some online video documentaries that provide realistic portrayals.

As I have noted for five weeks, Felix continues to feature selected energy holdings. Felix is not just a momentum trader!

Insight for Investors

I review the themes here each week and refresh when needed. For investors, as we would expect, the key ideas may stay on the list longer than the updates for traders. Major market declines occur after business cycle peaks, sparked by severely declining earnings. Our methods are focused on limiting this risk. Start with our Tips for Individual Investors and follow the links.

We also have a new page summarizing many of the current investor fears. If you read something scary, this is a good place to do some fact checking.

My bold and contrarian prediction for 2015 – that the leading sectors would lose and the laggards would win – looked a lot better this week. If I am correct, there is a very, very long way to run for the cheapest market sectors – energy, technology, cyclicals, and financials.

Other Advice

Here is our collection of great investor advice for this week:

Being Contrarian

If you were going to pick one link to read this week, I recommend this Michael Mauboussin piece. It will take a few minutes, but be worth your time. He explains, using some great examples, why it is not enough to be contrarian. You also must have edge! Sometimes (often?) the crowd is right. Markets may be accurately priced. Can you spot the difference? Will you be patient enough to let your system work? (I confess that part of my love for this work is that it is exactly what I and other value managers try to do).

The Quest for Yield

David Merkel does a great takedown of the new eBonds. We see another version of financial alchemy, turning risky assets into something with an AAA rating. Even if you cannot see a flaw, it might simply mean you need to look farther. Risk must be reflected somewhere, and you need to know whether counter parties can pay.

On the positive side in the quest for yield, Charles Sizemore makes the case for REITs. He explains why this should be a diversification for many and an alternative to bond funds.

Or maybe not! Oliver Renick and Brian Louis explain that REITs are over-valued and poised to fall. Expect bond-like, rate-sensitive performance.

Stock and Sector Ideas

Jeffrey Kleintop warns against being “fooled by currency.” Citing Europe and US multinationals, he notes that a “weaker currency is no substitute for a stronger economy.”

Someone is making a big bearish play in the XLU, the Utilities SPDR. The increase in put buying on Friday was 852%.

Consider using Liquid Alts both for hedging and diversification. Rob Martorana is our go-to expert on this topic. I am less worried than he is about the “aging bull” but I consider his recommendations with great interest and respect.

“Secret” hedge fund picks, leaked from a big-name conference. Including short ideas. (CNBC).

Market Outlook

Nouriel Roubini calls out the doom-and-gloomers. Here is a key quote:

One result of this global monetary-policy activism has been a rebellion among pseudo-economists and market hacks in recent years. This assortment of “Austrian” economists, radical monetarists, gold bugs, and bitcoin fanatics has repeatedly warned that such a massive increase in global liquidity would lead to hyperinflation, the U.S. dollar’s collapse, sky-high gold prices, and the eventual demise of fiat currencies at the hands of digital cryptocurrency counterparts.

None of these dire predictions has been borne out by events.

Mark Hulbert says that Dow Theory is now flashing a “sell signal.”

Final Thought

Risk. Many investors wisely begin by thinking about risk. That is how I start each interview with a potential client. Everyone has the need to protect a portion of the investment portfolio, with the assurance that any losses will be modest.

It is not always easy to identify safety. Last year’s most successful investments were bonds and bond proxies. The quest for safe yield has become a crowded trade. Those celebrating the success of bond mutual funds and their utility payouts should look at this week’s results. It is a very small taste of what will happen when interest rates return to more normal levels.

Reward. And we all need some investment reward, either to keep pace with inflation or to increase the retirement nest egg. There is excessive focus on arguments about the overall market valuation. There are plenty of cheap stocks and sectors.

Take only one example. The energy names that I mentioned in the annual preview – refiners and integrated oil companies that actually can benefit from lower oil prices – are all up about 10% in less than a month. (VLO, MPC, CVX).

Regional banks that allegedly have exposure to energy company loans are another happy hunting ground.

See the original article >>

Greece Gambles On "Catastrophic Armageddon" For Europe, Warns It "Only Has Weeks Of Cash Left"

by Tyler Durden

One of the bigger problems facing the new, upstart Greek government, which has set before itself the lofty goal of overturning 6 years of oppressive European policies and countless generations of Greek cronyism, corruption and tax-evasion is not so much the concern about deposit outflows and bank runs - even though it most certainly will be in the next few days unless the Tsipras government finds some resolution to the dramatic standoff with Merkel and the ECB - but something far more trivial: running out of money.

Recall that two weeks into the Greek elections, Greece was rocked by a dire, if entirely underappreciated development, when its already "tax-paying challenged" population decided to completely hold off paying any taxes in advance hopes that the Tsipras government will "overturn" austerity. We wrote:

... while there will be no official confirmation whether Greece did or did not have a bank run for months, unless of course some bank keels over and dies in the interim, one thing is certain: with an increasing probability they may not have a "continuity-promoting" government in less than two weeks, Greeks tax remittances to the government, which were almost non-existent to begin with, have ground to a halt!

According to a second Kathimerini report, budget revenues have slumped over the last few days as a result of the upcoming elections and taxpayers’ uncertainty about the future: "Most taxpayers have chosen to delay their payments, given that the positions of the two main parties leading the election polls are diametrically opposite: Poll leader SYRIZA promises to cancel the ENFIA and even write off bad loans, while ruling New Democracy acknowledges the difficulties but is avoiding raising issues that would generate problems and fiscal consequences.

The dwindling state revenues will not only hamper the next government’s fiscal moves, but, given that the fiscal gap will expand, also negotiations with the country’s creditors.

The tax collection mechanism appears to be largely out of action while expired debts are swelling due to taxpayers’ wait-and-see tactics and the reduction in inspections.

So for battered, depressed Europe "austerity" really meant "taxation" - it is no surprise then why so many in peripheral Europe, who for the past 7 years have not seen any benefits from Germany's delay in reintroducing the Deutsche Mark (and keeping its export industry humming, and Deutsche Bank solvent, courtesy of the much lower Euro), hate "austerity" so much: after all there really should be no "austerity" without representation and most European voices hardly matter in a monetary "Union" where only bankers and unelected eurocrats are heard.

But going back to the main topic, namely the Greek liquidity situation, it was none other than the Eurogroup which late on Friday gave Greece a 10 day ultimatum to cede all demands and resume work under the Bailout program, or face a liquidity collapse and effective expulsion from the Eurozone. Which means suddenly Europe is engaged in the biggest bluff since 2012, as Greece and Europe both desperately try to outbluff each other that the "adversary" need it more than vice versa.

The problem is that Greece may not even have 10 days. As the WSJ reports, "Greece warned it was on course to run out of money within weeks if it doesn’t gain access to additional funds, effectively daring Germany and its other European creditors to let it fail and stumble out of the euro."

Greek Economy Minister George Stathakis said in an interview with The Wall Street Journal that a recent drop in tax revenue and other government income had pushed the country’s finances to the brink of collapse.

“We will have liquidity problems in March if taxes don’t improve,” Mr. Stathakis said. “Then we’ll see how harsh Europe is.

As we reported last month, "Government revenue has declined sharply in recent weeks, as Greeks with unpaid tax bills hold back from settling arrears, hoping the new leftist government will cut them a better deal. Many also aren’t paying an unpopular property tax that their new leaders campaigned against. Tax revenue dropped 7%, or about €1.5 billion ($1.7 billion), in December from November and likely fell by a similar percentage in January, the minister said. Other senior Greek officials said the country would have trouble paying pensions and other charges beyond February."

Said otherwise, when Yanis Varoufakis responded to Europe that "Greece already is bankrupt" he knew exactly what he was talking about.

And as the WSJ further details, this means that the infamous ultimatum on Greece may have been set by none other than Greece itself!

Greece has made no secret of its precarious financial position, but the minister’s comments suggest the country has even less time than many policy makers thought to resolve its standoff with Europe.

Eurozone officials have asked Greece to come up with a specific funding plan by Wednesday, when finance ministers have called a special meeting to discuss the country’s financial situation.

The country needs €4 billion to €5 billion to tide it over until June, by which time it hopes to negotiate a broader deal with creditors, Mr. Stathakis said, adding that he believes “logic will prevail.” If it doesn’t, he warned, Greece “will be the first country to go bankrupt over €5 billion.”

What happens then: "If the Greek government runs out of cash, the country would be forced to default on its debts and reintroduce its own currency, thus abandoning the euro. Most of the €240 billion in aid that Europe and the International Monetary Fund have pumped into the country would be lost."

Of course, Greece knows all this. The bigger question is what does a Grexit mean for Europe. Recall it was in May 2012, just around the time of the second Greek bailout, that Charles Dallara, who as head of the International Institute of Finance (IIF) spent months in Athens negotiating the largest ever sovereign debt restructuring, said that "the damage to the rest of Europe from Greece leaving the euro would be "somewhere between catastrophic and Armageddon."

"I think that it (a Greek exit) is possible, but I wouldn't call it inevitable and I wouldn't even call it likely because the costs for Greece, for Europe and for the global economy are likely each in their own way to be immense."

"The pressures on Spain, Portugal, even Italy and conceivably Ireland could be immense and the need for Europe to step up with much greater support for the banking systems would be substantial."

If that isn't enough here is what Willem Buiter predicted:

As soon as Greece has exited, we expect the markets will focus on the country or countries most likely to exit next from the euro area. Any non-captive/financially sophisticated owner of a deposit account in that country (or in those countries) will withdraw his deposits from banks in countries deemed at risk - even a small risk - of exit.  Any non-captive depositor who fears a non-zero risk of the future introduction of a New Escudo, a New Punt, a New Peseta or a New Lira (to name but the most obvious candidates) would withdraw his deposits from the countries involved at the drop of a hat and deposit them in the handful of countries likely to remain in the euro area no matter what - Germany, Luxembourg, the Netherlands, Austria and Finland.

The funding strike and deposit run out of the periphery euro area member states (defined very broadly), would create financial havoc and mostly like cause a financial crisis followed by a deep recession in the euro area broad periphery.

...

A banking crisis in the euro area and in the EU would most likely result from an exit by Greece from the euro area. The fundamental financial and real economy linkages from the rest of the world to the euro area and the rest of the EU are strong enough to make this a global concern.

And of course, there was Carmel's presentation from the summer of 2012, comparing the costs to Germany from a Euro staying together versus falling apart:

That is precisely the gambit the Greece is playing right now: in fact, that is the only gambit it has left - one final gamble that kicking Greece out of the Eurozone will have far more devastating consequences on the Eurozone, where not only is the ever-persistent threat of deposit bank run from the periphery one flashing red headline away, but where one after another anti-European party, from Spain's Podemos to Marine Le Pen's surge in France, are ascendent and may seek to recreate the Greek example unless Germany steps in in the last minute and concedes the Greek demands.

The problem is that as Merkel understands very well, should she concede to Greece, then she would be expected to concede to Italy, and Spain, and Portugal, and Ireland, and anyone else who came knocking at her door with a loaded gun and threatening to commit suicide. The WSJ picks up on this as well:

Europe wants Athens to commit to further labor-market and other reforms as a precondition for more money. The new government is refusing, arguing that it was elected to turn back many of the painful measures Europe and other creditors have demanded of it. 

Berlin worries that the eurozone would lose leverage over Athens if it gives into its request for an interim loan. Without a binding agreement from Greece to continue its reform program, officials say Germany is unlikely to back down.

Berlin, which is counting on financial pressures to force the Greek government’s hand, believes time is on Germany’s side.

And for now, it is correct: "Those pressures are being felt across Greece’s economy. Its banks lost €8 billion to €10 billion in deposits in January alone, government officials say. The banking system’s woes were exacerbated by the ECB’s decision earlier in the week to no longer accept Greek government bonds as collateral from banks seeking funds."

As Zero Hedge pointed out several times last week, both the ECB, the Eurogroup and even S&P, are no longer concerned about starting a bank run in Greece, as this would be the surest way to crush support for the new Greek government and force it to the negotiating table with its tale between its legs. Furthermore, in order to avoid giving the Greeks the satisfaction that their strong-arm policy is working, the central banks have done everything in their power to keep stock markets afloat and levitating this week, to avoid giving the impression that anyone in the world is concerned about contagion side-effects should Greece in fact exit the Eurozone. Or as we put it:

This strategy may, however, backfire and result in even more support for the government which unlike its predecessors who were perceived merely as Europe's lackey muppets, refuses to concede to Merkel, which is a distinct risk for the German chancellor:

Germany’s strong-arm strategy carries substantial risk. In addition to possibly triggering Greece’s exit from the euro, it carries political overtones.

Many Europeans already view Germany as the continent’s unyielding paymaster. Refusing to compromise with Greece’s new government over a few billion euros would further cement that image and open Berlin to accusations that it is ignoring Greece’s plight and riding roughshod over the democratic process.

Such resentments could fuel Europe’s other ascendant anti-austerity movements, particularly in Spain, where the Podemos party, modeled on Greece’s governing leftists, has recently surged in the polls.

And that's the gamble in a nutshell: Greece has already bluffed with everything it has (even raising the specter that it will cooperate with Russia if Europe kicks it out, giving Putin a foothold on the continent) while Europe desperately pretends that Charles Dallara's warning from less than three years ago is no longer relevant and that a Grexit is not only neither "catastrophic" nor "Armageddon", but instead is welcome and perfectly normal.

We should know who will crack first as soon as this week, just before or during the Eurogroup emergency meeting on February 11, although Greece already appears to be regretting its liquidity shortfall threat, as Reuters reported earlier today it "will not face any cash crunch while negotiations with its euro zone partners on a new programme to roll back austerity take place, its deputy finance minister said on Saturday. "During the time span of the negotiations there is no problem (of liquidity). This does not mean that there will be a problem afterwards," Deputy Finance Minister Dimitris Mardas said on Mega TV. "Asked whether state coffers may encounter a cash crunch if talks drag on until May, the minister said he did not expect the negotiations over a new deal to last that long."

Indeed, if Greek negotiations fail, read if the bluff does not succeed, by May Greek state coffers will likely be getting funding from Beijing and or Moscow. Which then begs the question: has Greece indeed lost everything, allowing it to be finally free to do anything?

See the original article >>

Saturday, February 7, 2015

The Week Ahead: Will Apple or Energy Stocks Revive the Market?

by Tom Aspray

It seems certain that most investors will be glad January is over and are hoping that February will be less volatile. Many are worried that a lower close in January will mean a lower close for the stock market in 2015.

The so-called January Barometer, developed by Yale Hirsch, has an 88% chance of determining where the market will close using data since 1950. This does not include years where the market closed flat. Recently, it has not been as accurate. The S&P 500 closed January lower in 2014 (-3.43%), 2010 (-3.82%), 2009 (-8.54%), 2008 (-6.09%), and 2005 (-2.53%).

The Spyder Trust (SPY) had a positive return in each of these years except 2008. Data from Morningstar shows the following annual returns: 2014 (13.46%), 2010 (15.06%), 2009 (26.32%), and 2005 (4.83%). In every year except 2008 and 2009, the S&P 500 was also up the following February.

Click to Enlarge

However, I would not expect a return to low volatility in the near future and it could last for most of the year. The Wall Street Journal chart shows that the volatility spiked in October as crude oil started its collapse. An increase in volatility is not surprising as the prior two years had historically low volatility. So far this week, the S&P 500 has had some extreme ranges which have averaged 1.5% daily.

This earnings season has been full of both positive and negative surprises and it isn̢۪t over yet. Several big-cap names have been hit hard as Microsoft (MSFT) will close at the lowest level in six months, while Caterpillar (CAT) made a new low for the year.

This is where the relative performance analysis can be quite helpful as I noted in my review of the big banks before they reported earnings. The analysis of the regional banks also looks negative, suggesting they will continue to be weaker than the S&P 500. The financial sector has been the poorest performer, so far, in 2015.

The stock market seemed to be more interested in the earnings from Apple, Inc. (AAPL) last week than they were about the FOMC announcement. Over the past few weeks, I had received some inquires about my technical view for Apple̢۪s stock.

Following Comments Unfollow Comments

Click to Enlarge

Therefore, in Tuesday’s column Buy Apple on an Earning’s Miss, I looked at the monthly, weekly, daily, and intraday charts. On all time frames, the technical studies indicated that AAPL had completed its correction from the November high. The weekly chart shows the break of the downtrend, line a, on January 23.

The weekly relative performance had also turned higher and moved back above its WMA and the recent high. The OBV multiple time frame analysis was also positive, consistent with the end of its pullback. It should close the week at another new high.

With the stock̢۪s close Monday at $113.10, a pullback was required to set up a favorable entry price and keep the risk in the 5% area. At the time, I thought it would take an earnings miss to drop the stock to the recommended buying levels. Instead, the stock was hit hard along with the rest of the market, closing before the earnings at $109.03. It is trading at $119.50 early Friday afternoon.

As always, my article elicited a host of comments from people who thought I either was predicting lower earnings, hoping to drive the stock down for my own benefit, or just was not familiar with the company at all. As a technical analyst, I never predict earnings.

Though I do not currently own an Apple computer, I started doing technical analysis on a series of three networked Apple II computers thirty-three years ago and I have followed the company every since. I do not own any Apple stock except in a mutual fund and do not recommend stocks that I own. I certainly was not short the stock, given the positive technical readings.

This news was followed by very surprising earnings from Amazon on Thursday as they actually reported a profit. The stock is up over 13% in early trading on Friday. There were some casualties as Qualcomm (QCOM) dropped 11% last Thursday on disappointing earnings and the apparent loss of some chip business with Samsung.

So, can Apple and the technology sector take the market out of its trading range and provide the fuel for another push to the upside?

Following Comments Unfollow Comments

Click to Enlarge

The monthly chart of the Dow Jones Technology Index (DJUSTC) made a slightly higher high in December before closing lower. It is also set to close down over 3% in January. The sector was hit hard in October as the long-term support, line a, was tested. This month’s low took the index back to where it closed in October.

The monthly relative performance broke its downtrend, line c, at the start of 2014. It is still well above its rising WMA but below the 2012 high. The monthly OBV has turned lower but did make a new high in November.

The weekly studies (not shown) are slightly negative and a weekly close under 1012 would signal a deeper correction. The index needs a close back above 1045 to complete the recent sideways pattern on the daily chart.

Though there are plenty of companies still to report, from a technical perspective, I can’t count on technology to turn the market higher right now. Actually, I think the energy sector has a better chance as many of the large oil companies have held up pretty well after their earnings were released. It may be that their weak earnings and spending cuts are already factored into their stock prices.

Click to Enlarge

The energy sector and crude oil prices do have a seasonal tendency to bottom in February. The seasonal chart of crude oil shows a typical peak in July, line 1, which is followed by a decline into December.

Historically, the final low comes in early February as indicated by line 2. Though crude was down a bit last week, the March contract will form a weekly doji. Therefore, a close this week above $46.55 would trigger a HCD buy signal.

Higher crude would help calm the increased fears of deflation as the EuroZone reported a drop of 0.6% in the year through January. This will help the ECB sell its quantitative easing plan.

It is also thought that the lower crude oil prices will stimulate buying in other areas. In fact, Spain’s economy is showing the strongest growth in seven years. I continue to expect that the EuroZone economy will surprise many by the end of the year.

The very weak Durable Goods report last Tuesday helped increase the selling in an already weak stock market. The media ignored the sharp rise in Consumer Confidence to 102.6, which was the highest reading since 2007. I had thought last week that it would get above 100 soon but not that fast.

Click to Enlarge

The New Home Sales also beat expectations, while the Pending Home Sales were weaker than expected as they declined 3.7% in December. Last Friday’s GDP report disappointed economists as it reflected a growth rate of just 2.6%. Most were expecting GDP to grow 3.2%. Much of the gain was a result of consumer spending, but it did reverse the positive trend of the past two quarters.

The Chicago PMI came in stronger than expected on Friday while the University of Michigan’s Consumer Sentiment reading of 98.1 held on to the strong mid-month reading.

This week, the focus will be on manufacturing and jobs. On Monday, we get the PMI Manufacturing Index, ISM Manufacturing Index, and Construction Spending. This is followed on Tuesday by Factory Orders.

Along with the ADP Employment report on Wednesday, we also get the ISM Non-Manufacturing Index with the monthly jobs report on Friday.

What to Watch

The stock market tried to rebound several times on Friday but the sellers took over in late trading to close the major averages near the day’s lows. Therefore, some of the key ETFs may close the week below their quarterly pivot levels (see Pivot Table here). This will be updated in Monday’s column.

The failure of the market to respond more positively from the prior week’s upside reversal is a concern. In last Friday’s column Any Warnings from the Monthly Charts?, I took a detailed look at the monthly charts of the NYSE Composite, Spyder Trust (SPY), PowerShares QQQ Trust (QQQ), and the iShares Russell 2000 (IWM).

The monthly indicators typically warn of more significant corrections like we saw in 2011. As I noted last week, a strong close was needed to turn the weekly studies higher. The weekly studies on all the averages except the NYSE Composite have deteriorated further.

A break of the widely watched 1990 level in S&P 500 is likely to trigger heavier selling. If we do see such a further downside break this week, we are still likely to see a snap back rally that will allow us to adjust our strategy. In light of the detailed analysis of the monthly charts, I will focus today on the weekly charts of two key market tracking ETFs.

The daily studies are close to generating additional sell signals and may do so today once the final numbers are in. Some stocks, like those recommended in Three Market Leading Healthcare Picks, are likely to hold up better than the major averages.

The sentiment picture also reversed last week as the bullish % from AAII rose from 37.14% to 44.17%. More importantly, the bearish % dropped sharply from 30.79% to 22.39%.

Click to Enlarge

The 5-day MA of the % of S&P 500 stocks above their 50-day MAs turned down last week as it closed at 47.97%, which is one standard deviation below the mean of 65.01%. This suggests that it could drop below the January 20 low of 41.36% before the correction is over.

The weekly chart of the NYSE Composite shows that it looks ready to close below the 20-week EMA at 10,770 but may finish above the quarterly pivot at 10,597. These levels can be a valuable way to navigate volatile markets.

There is further weekly support from early January in the 10,440 area, line a. This also corresponds to the monthly projected pivot support for February. The weekly starc- band is at 10,216.

Click to Enlarge

The weekly NYSE Advance/Decline will turn down this week but is still close to an all time high. It would take a week or more before it breaks decisively below its still rising WMA. There is more important support at line b. The daily A/D line is still holding above its WMA.

The weekly on-balance volume (OBV) has deteriorated in the past week as it has dropped back below its WMA, which has now flattened out.

A daily close back above the 10,870 level would be positive.

S&P 500
The weekly Spyder Trust (SPY) has been in a tight range over the past four weeks, despite the wide daily swings. In afternoon trading, it is still above the quarterly pivot at $199.42. The starc- band is at $196.76 with further support in the $194 area.

Click to Enlarge

A daily close above $206.50 would be an important sign that the market is ready to move to new highs. The weekly starc- band is now at $215.74.

The SPY moved above and below the slightly rising 20-week EMA at $202.97 quite a few times last week.

The weekly S&P 500 A/D line made a new high at the end of 2014 and is holding just slightly above its WMA. The daily A/D line (not shown) is still holding above its recent lows but is slightly below its WMA.

The weekly on-balance volume (OBV) looks ready to close the week below the previous low and its WMA, which is a bearish sign. It is still well above the long-term support at line c. The daily OBV is just below its declining WMA.

Nasdaq 100
The PowerShares QQQ Trust (QQQ) continues to hold above the quarterly pivot at $99.67, which also corresponds to the four week lows. The weekly starc- band is at $96.59 with the weekly support at $94, line d.

The Nasdaq 100 A/D line made twin peaks in December and is likely to close just below its WMA. It is also quite close to the longer-term uptrend, line e. There is more important support now at the October lows. The daily A/D line formed higher lows last week, but closed below its WMA.

The weekly OBV dropped below its WMA in the first full week of January and has now moved below the prior low. It is therefore now in a short-term downtrend. With the higher close on Friday, the daily OBV (not shown) is back above its WMA.

There is minor resistance now at $103.18 with more important at $104.58. A daily close above this level is needed to shift the short-term momentum to the upside. There is additional resistance in the $105.25-$105.86, which is the upper boundary of the recent trading range.

See the original article >>

SPY Trends February 7, 2015

by Greg Harmon

Last week’s review of the macro market indicators suggested, heading into February the equity markets looked biased to the downside to start the month. Elsewhere looked for Gold ($GLD) to continue to consolidate in the short term uptrend while Crude Oil ($USO) was ready for a bounce or reversal in the downtrend. The US Dollar Index ($UUP) seemed ready to consolidate sideways in the uptrend while US Treasuries ($TLT) continued to be biased higher.

The Shanghai Composite ($ASHR) was also consolidating in its uptrend while Emerging Markets ($EEM) looked to have failed in their attempt to rally and were biased to the downside. Volatility ($VXX) looked to remain low but drifting up easing the wind behind the equity markets to a light breeze. The equity index ETF’s $SPY, $IWM and $QQQ, all saw risk to the downside in both the daily and weekly charts with the QQQ the strongest on the longer timeframe followed by the IWM and then the SPY, but the IWM possibly a bit stronger on the short timeframe over both the QQQ and SPY.

The week played out with Gold drifting lower in consolidation before falling to end the week while Crude Oil started higher. The US Dollar consolidated all week in a slight downward path while Treasuries pulled back all week from the new high. The Shanghai Composite continued to pullback from the highs, consolidating the big move, while Emerging Markets tried to rally again and failed. Volatility pulled back from the high but remained above the range of move of 2014. The Equity Index ETF’s all bottomed on Monday and moved higher the rest of the week with the SPY and IWM making higher highs but the QQQ lagging. What does this mean for the coming week? Lets look at some charts.

SPY Daily, $SPY
spy d

The SPY started the week making a marginal new low Monday. At that point a series of two lower highs and two lower lows. A downtrend despite the consolidating look. But that did not even last until the afternoon as it started higher. The next 3 days continued higher and ended by making the first new marginal higher high of the year. Downtrend over? Friday messed that up again moving higher to start but reversing to close down on the day. A good week over all. The RSI on the daily chart shows another leveling just over the mid line, neither bullish or bearish, while the MACD is starting to drive higher. A continuation and follow by the RSI could turn the market higher.

SPY Weekly, $SPY
spy w

The weekly chart shows the consolidation range continuing for the 14th week between 200 and 209. The positives are that the RSI has held over the mid line the entire time as it pulled back, in the bullish zone, and the MACD may be turning back towards a bullish cross. The 50 week SMA is still below and a touch there has been what it has taken to trigger a move higher. There is resistance at 206.40 and 209 before a Measured Move higher to 225. Support lower comes at 204.30 and 202.30 before 200 and 198.60. Continued Consolidation in the Uptrend.

Heading into next week the equity markets are coming off of a good rebound higher but showed signs of exhaustion Friday. Elsewhere Gold looks to continue to pullback while Crude Oil tries to move higher off of a bottom. The US Dollar Index may continue to consolidate the rise, pulling back mildly, while US Treasuries are biased lower in their uptrend. The Shanghai Composite looks to continue its pullback from a major run higher and Emerging Markets continue to consolidate in a bear flag in their downtrend.

Volatility looks to remain low but slowly rising slowing the wind be=hind equities to move higher. The equity index ETF’s SPY, IWM and QQQ, are all in a consolidation pattern in the intermediate term, despite the moves higher last week. The IWM looks the strongest and may test the all-time highs this coming week while the SPY is close behind but the QQQ a bit weaker. Use this information as you prepare for the coming week and trad’em well.

See the original article >>

Follow Us