I begin the publication of the daily statement of account on which works our Super Commodity System.

I begin the publication of the daily statement of account on which works our Super Commodity System.
By Tyler Durden
In a moment of surprising clarity, Deutsche Bank's Jim Reid pointed out what is largely taboo in the financial industry - the truth. "Looking back, real GDP growth in the US through the latter half of the 2000s and the 2010s has been at the lowest levels since the cyclically scarred decades of the Great Depression and the First World War."
What is amusing, is the constant state of shock of supposedly serious people who are stunned that despite the Fed being constantly in the markets, and buying up trillions in securities, the US economy has not responded in a favorable manner. Of course, nobody has pointed out that if all it took to generate growth out of thin air without consequences was for the Fed to print, i.e., monetize debt, this would have started 100 years ago in 1913, and by now the US economy would be so advanced it would be colonizing Uranus. Logic, however, is not a Keynesian economist's best friend.
That said, the reasons surrounding the lack of US growth are secondary for the time being. A bigger question is what happens from here, now that even respected banks, and even ivory tower economists have admitted that QE has been a complete failure for the broader economy, and the common American, benefiting only the uber-wealthy. Which leads us to a different topic. Syria.
With much of the discussion behind the motives for the Syrian (at first, then coming to a city near you) war focusing on gas pipelines, chemical weapons, moral right, exceptionalism or the lack thereof, boosting deficit spending and permitting the untaper, one issue has been left unaddressed. Perhaps the most important one. Economic growth. Which is surprising, it is not as if the US has not found itself in a position in which its real economic output was far lower than its potential output.
For an uncanny historical analogue of the current economic predicament, we have to go back only 70 years or so back, to the time of the first Great Depression: that was the first and ostensibly last time, when the US economy was performing in a comparably subpar fashion to trendline.
So in an extreme (if logically forthcoming) scenario when the Fed's final proposed fallback strategy of "forward guidance" which is destined to replace QE now that tapering is on the table, were to fail, as many already suggest it will (just look at the BOE), the final solution for the US central bank is one - Nominal GDP Targetting, which stripped of its fancy title is really a euphemism for "print until you drop", or rather monetize securities and inject money without regard for inflation (paradropping bundles cash may well be allowed as Ben Bernanke would be happy to admit), with the only intention of promoting growth at any cost.
So here is what Deutsche has to say about this potential outcome:
There has been some debate about possibly targeting the level of NGDP and perhaps such a policy should get more airtime. Such a policy was first mooted in the late 1970s and by the late 1980s was offered as a possible successor to the money targeting of that decade. A NGDPT would embody two major changes from current policy. First the central bank would act to stabilise nominal GDP, rather than inflation, at some constantly increasing level. Second it would target the level of nominal GDP rather than its rate of change.
The special feature of NGDPT is this second distinction. Currently if a central bank aiming to hit a 2% annual inflation target were to undershoot and achieve only a 1% rate then when the next year came around, the central bank would have to enact monetary policy still with the aim of hitting a 2% inflation rate. It’s 1% miss the previous year is forgotten. With a level target if the central bank’s objective is to hit a level of NGDP 2% higher at the end of the year then at the start, and it achieved only a 1% increase, then in the next year it has to make up for lost ground and put in place expansionary policies to grow the nominal economy by an extra 1% on top of the +2% it would have been expected to hit anyway.
This demand to correct for past mistakes can have big implications down the road. Let’s continue with the above example of the central bank who undershoots by 1%. After 5 years (see Figure 90) the central bank would have to try to generate 7% nominal growth in the next year. After 10 years it would need 13% nominal growth. After 100 years the hapless undershooter would need to almost treble (x2.7 or +170%) the size of the nominal economy.
This last and rather extreme figure isn’t far away from where a nominal GDP targeting Fed would have found itself in 1933 (see Figure 91, LHS). If the Fed had been told to achieve a level of nominal GDP consistent with a 5%-a-year growth rate (the 1790-1929 average) after 1929 then by 1933, after 3 years of Depression, the Fed would have had to have generated 135% growth in 1934 to get back on “target”. As it turned out, the US economy managed to grow at an average of 13.5% a year over the next 10 years and was back on ‘target’ by 1944.
We'll get back to this key bolded sentence in a second, but first let's conduct a thought experiment of a world in which the Fed was expected to "catch up" to its trendline growth rate until the collapse of Lehman:
Fast forward to the end of 2012 and assuming the central bank was targeting a level of NGDP consistent with an increase post-2007 at its NGDP 1990- 2007 average growth rate of 4.7% (see Figure 91, RHS) then the central bank would need to ensure a 2013 growth rate of 18%. Assuming a more spaced out catch up rate of reducing the gap by 2% a year then the US economy would be back on track by 2019 (see Figure 92), requiring an average growth rate of 6.7% a year.
The key difference between a nominal GDP target and an inflation target is that central banks would, after a period of economic slowdown, be ready to accept a higher inflation level and/or (ideally) above-trend real GDP growth for a time to get the economy back on track. Inflation picking up to 3%, 4% or even 5% a year would no longer be viewed as a failure of the central bank. Indeed it would likely be a central aim of its policy as it seeks to eliminate the nominal GDP “gap”. For this reason adopting a Nominal GDP target would mark a fundamental change in monetary policy, far beyond what has so far been seen. Would it be a change for the better or for the worse?
Rhetorical questions aside, the problem with 5% or higher inflation, aka "central bank success" is now a non-starter for the simple reason highlighed earlier, namely that over the past five years the US has generated $1 of GDP for every $18 of debt, leading to a G7 debt/GDP of a mindboggling 440%, the function of $140 trillion in consolidated "developed world" debt.
And since inflation brings with it a comparable rise in rates, suddenly this mountain of debt would be forced to generate cash interest payments. As Deutsche Bank opined:
In an ultra low interest rate environment (short and long-term rates), it’s possible to carry this debt in a low growth environment but with little deleveraging taking place it creates a fragile environment that leaves these economies vulnerable to shocks and policy errors.
If rates were to rise notably from these ultra low levels, this could be just such a shock. This is why in spite of the recent sell-off, rates are likely to stay lower for longer as the alternative could be highly destabilising given the extreme debt burden being carried across large parts of the world.
In other words, targeting GDP for the sake of GDP, concerns about inflation aside, when soaring inflation would also lead to surging interest rates, has become impossible.
So what is the only possible way out left for a country in which monetary policy has failed on all fronts except to inflate asset prices to stratospheric levels, and yet the economy still refuses to budge? For the answer we go to Deutsche Bank one last time:
During the US Great Depression the huge declines in consumer and businesses confidence in the face of mass unemployment can be seen in the extremely and persistently low level of velocity.... As it turned out, the US economy managed to grow at an average
of 13.5% a year over the next 10 years and was back on ‘target’ by 1944.... Velocity also moved during the recovery from the Great Depression as the US war machine swung into action in the early 1940s.
In other words, at a time when the US was in almost an identical predicament and GDP catch up would have been impossible by any other means, what happened? World War. Luckily, for the US it generated unprecedented growth and cemented its status as the world's super power, and the USD as the reserve currency. Others were not so lucky.
Are we the only ones who suggest that the only outcome is a military one? No. Recall from Kyle Bass:
Trillions of dollars of debts will be restructured and millions of financially prudent savers will lose large percentages of their real purchasing power at exactly the wrong time in their lives. Again, the world will not end, but the social fabric of the profligate nations will be stretched and in some cases torn. Sadly, looking back through economic history, all too often war is the manifestation of simple economic entropy played to its logical conclusion. We believe that war is aninevitable consequence of the current global economic situation.
"Inevitable"
Which also means preconceived from the start. So despite a recent sense of detente in Syria, pay close attention: never since the cold war has the world been so close to the edge of a full-blown global military conflict. Whether or not the Syria "trigger" has been produced as the catalyst that will spark growth, or is merely a precursor to such an event is still unclear. However with every passing day, the US economy lags ever more behind its "trendline" and the common man gets left ever further behind the superclass of financial asset oligarchs, a state which the president opined recently was unacceptable. The question is whether millions of war casualties for the sake of yet another economic "golden age" aren't.
By J.W. Jones
Oil prices (NYMEX:CLV13) have been in the spotlight as the Syrian chemical weapons crisis became front and center in the media. As the political process has unfolded, price volatility in oil futures in both directions has been extreme. Oil prices have traded in a wide range the past two weeks between $104 - $112 dollars per barrel.
As a professional option trader, I wanted to look at what the implied volatility within options on oil futures was saying about future oil prices. The oil futures option chain would give me some possible clues about near and intermediate term price direction.
As an options trader, I am constantly focused on implied volatility. I regularly look for stocks or futures that are showing implied volatility levels which are higher than their historical average. The very first thing I look at is the implied volatility skew across multiple option chains with different expiration dates. As such, when I looked at the oil futures option chains I noticed that the longer dated expirations had a slightly higher than normal implied volatility.
It is normal for the longer dated expirations to have higher volatility levels, but what was striking to me was the implied volatility in December was not much higher in the December oil futures options than what it is in the front month expiration. I found this odd so I looked at the spot oil futures prices going out in time. The following chart comes directly from www.cmegroup.com.
As can be seen, as you move out further in time the oil futures prices decline. This is a condition in the oil futures market known as backwardation. According to Goldman Sachs in an article posted HERE:
“This rise in backwardation in oil, in our view, is not driven by the events in Syria, but rather by increasingly tighter fundamentals that are a result of the production shortfalls in Libya and Iraq against improving Chinese demand.”
Essentially Goldman Sachs’ analysts go on to say that they believe oil prices will see modest declines over the next 12 months, but the backwardation will likely lead to returns being mostly flat over the next year.
The fundamental backdrop according to Goldman Sachs appears to be bullish in the short-term based on supply data. Unfortunately fundamentals usually explain why an underlying asset moved the way it did after the fact. Making money in the short term as a trader is difficult when basing entry and exit decisions solely on fundamentals.
With the fundamental backdrop explained, I thought it would make sense to look at key technical levels in the oil futures price chart. The chart below illustrates key price levels based on recent price action in oil.
Obviously the consolidation zone is setting up for a large move in oil prices. The more important question to answer is which direction will oil prices move? Will we see activity or supply data that pushes prices above the resistance zone? Under that scenario, the next logical price target for oil would be between $121 - $130 per barrel.
Should prices reverse course and break below support we should see strong buyers come in around the $90 - $95 per barrel price zone. At this point, the next stage in my analysis is going to be probability based support and resistance for oil futures.
This process has to do with calculations involving implied volatility to derive a probability based on price action today. Clearly those probabilities change constantly, but the probability data set is accurate in real time or at the time of entry.
Traditionally I will use standard deviations to help determine price ranges as well as setting up trades that are directional such as credit or debit spreads. Other times I will use standard deviations to place credit spreads like Iron condors which focus more on the passage of time and are generally more agnostic to price action.
One standard deviation is typically calculated as 68%. Based on the options on oil futures which expire in 36 days on October 18th, a one standard deviation move would place oil prices around $103 per barrel to the downside. A one standard deviation move to the upside based on Wednesday’s closing prices would put oil prices around $110 per barrel.
Interestingly enough, the price range expectations for a one standard deviation move from current prices today (09/11) at the close fits precisely into the price range discussed above using technical analysis.
Varying data lining up like this does not always happen this precisely, however when key price levels line up in this manner it should not be ignored. The option data is basically indicating that there is a better than 68% probability that in 36 days the price of oil will be in the $103 - $110 per barrel price range.
The oil futures price chart shown below illustrates a two standard deviation move. The lines drawn on the chart below demonstrate the next key price levels should a 2 standard deviation move occur from the current price at the October option expiration.
It is important to understand that there is roughly a 10% probability that oil will even touch either key price level shown above before the October 18th expiration. So what do all of these probability calculations tell us?
Right now the implied volatility in the options that expire on October 18, 2013 based on current oil futures spot prices has a low probability of seeing a surge higher or a major move lower. The option data essentially concurs with Goldman Sachs fundamental view that oil prices are likely to stay in a trading range and probabilities do not favor a big unexpected move.
I would point out however, that the probabilities for a big move are not 0%. There is a 1 in 10 chance that we see a big surge or breakdown in price. As far as I am concerned, this is the option markets calculated odds on any major escalation taking place in Syria or the Middle East prior to October 18, 2013.
I think in the short-term we could see oil futures prices move up toward $115 / barrel. However, the probabilities simply do not favor a prolonged move above that level. Furthermore, it seems likely that when the Syrian debacle concludes that prices will be more likely to be in the $103 - $110 price range in roughly one month.
Instead of reading articles written by pundits who are making price projections based on an educated guess, why not let the options market be a guide for where the marketplace is pricing in the next move. The analysts that are calling for a monster move in oil in the near term have roughly a 10% probability of being right. I will let readers decide whether a pundit or the option pricing in oil futures is likely to be more accurate.
by Tyler Durden
No surprises here: Silver and Gold are the best, Banks and Greece - worst.
In USD terms:
And in local currency terms:
DB's commentary:
As one might have expected, on a total return basis (all in $ terms), Silver (100%) and Gold (73%) were the top two performers followed by European HY (60%), US HY (58%) and the S&P 500 (50%). Core rates have also done well as central banks propped up the fixed income markets by artificially keeping interest rates low for many years (even with the recent sell-off). Bunds, Treasuries, and Gilts managed to gain 23%, 20% and 20% respectively over the 5-year period. Despite the wobbles this year, EM equities and bonds are still up 33% and 29% over the same period as they have benefited from global liquidity and a mostly favourable growth outlook relative to DM. At the other end of the performance spectrum, Greek equities, down -66% since the Lehman bankruptcy to rank as the worst performer in our sample, are clearly still bearing the brunt of the European sovereign crisis. This is followed by the Stoxx600 Banks index (-30%), the FTSEMIB (-30%), and the Bovespa (-20%). The overall picture though is one of positive returns for most asset classes. We should add that this period ties in with our 5yr rolling nominal global growth being at the lowest since the 1930s so the performance of financial assets is almost entirely down to liquidity and not growth. Food for thought as tapering starts before growth has proved it’s self-sustaining.
The bolded sentence above, again, comes from Deutsche Bank.
by Tyler Durden
Still paying your 2-and-20, despite Stanley Druckenmiller's surprise that you would, for someone to pick stocks for you? Perhaps a glance at the following 3 charts will awaken the animal investing spirits in some (or just a 'fold' from many). This is what happens when there is only one economic market-driving factor (cough Fed cough) and too many coat-tail-clinging hedge fund managers (and newsletter writers) chasing too few real alpha opportunities. The correlation between the S&P 500 and hedge fund returns has never been higher and is approaching 1, excess return (alpha) is near its all-time lows, and, sadly, there is an extremely high correlation between styles and tilts. All your hedge fund alpha are belong to Ben.
Hedge fund managers have become high cost version of their index-tracking ETF brethren...
And performance advantages have dwindled...
as style tilts (growth vs value for instance) have seen increasing correlations...
Removing any and all systemic return generation aside from momentum chasing and dash-for-trash, home-run style investing... So lower excess returns and same risk as market?
From Stanley Druckenmiller...
On whether other managers can say ‘I’m going to take 2 and 20 and not invest:
“I don’t know. The way I always approach a business is, you give me a pile of money and I’m going to try and pound the money for you overtime as best I can. This whole quarterly performance and risk-adjusted stuff invading the hedge fund, I don’t get it. I can’t imagine why anybody would pay two and 20 to what is out there. When I started in the business, there was me, George Soros, Paul Tudor Jones, Bruce Kovner. We were expected to make 20-percent a year in down markets. There was none of this ‘Oh, I’ve got a risk-adjusted return of 8. That is how to two plus 20 came about.
On why Hedge Fund managers are less successful:
“There are too many, there were eight to ten back then. Somehow, 9000 people are pricing their product off of eight to ten people historic performance. I noticed a lot of the smart early investors and hedge fund clients were leaving, but they were more than replaced by state pension funds, sovereign wealth funds and so far they have been perfectly happy to get returns that our early investors would have never tolerated.”
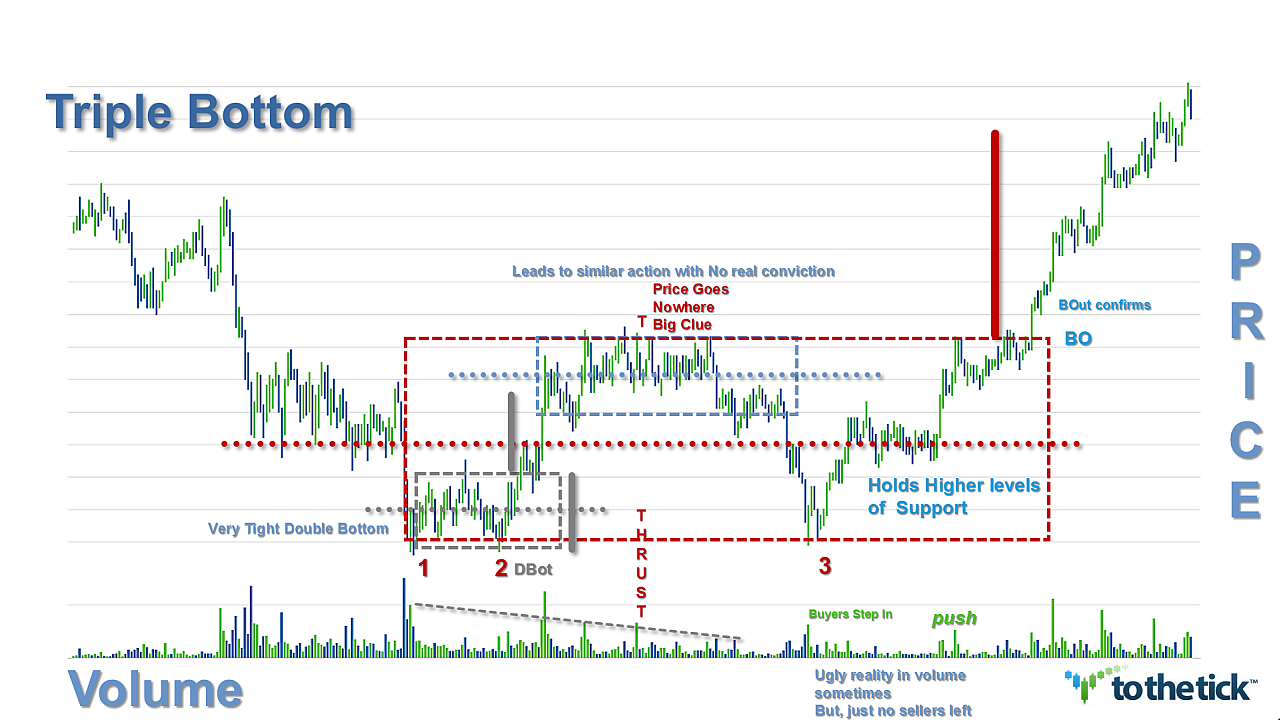
The Triple Bottom is a reversal price pattern & while not as common as the smaller Double Bottom it is seen in all markets, instruments, time frames, & price ranges. It presents with the immediate background environment as bearish with down-trending price action. The price pattern represents multiple failed attempts by sellers to break through an area of support and traders look for price to bounce back up. The classic Triple Bottom can be an indication that the established downtrend is losing strength & buyers may be gaining momentum possibly creating the end of the decline in prices. The Triple Bottom Reversal usually marks an intermediate or long-term change in trend & is therefore considered to have a definite bullish bias.
Visually the Triple Bottom pattern presents three consecutive minimums in price, ‘valleys or troughs’ that are roughly equal with the requirement of 2 moderate peaks or swing highs in-between. The price level of the highest swing high establishes what is called a ‘neckline’ & creates the immediate resistance for the pattern. Typically as this pattern develops overall volume levels usually decline. After a 3rd effort traders will look for an expansion of volume from the bulls to note conviction. The longer the pattern develops, the more significant the expected break.
Throughout development of the Triple Bottom traders should be prepared for the pattern to possibly resemble a number of other patterns before the third bottom forms. The ‘spirit’ of the pattern highlights a battle between buyers & sellers & it may take some time & not look perfect. Ultimately the ‘final’ picture is not complete until a confirmed breakout has cleared resistance…regardless of the ‘shape’. The inability to break support is bullish but the bulls have not won the battle until resistance has been broken.
Note that in the downtrend there may be many potential bottoms in price along the way down, but until significant resistance is broken, a reversal cannot be confirmed & traders should respect the trend.
While this pattern is fairly straightforward it should be noted that traders often ‘jump the gun’. Not all repeated lows produce a change of trend & traders need to remember that the trend is in force until proven otherwise. Bottom formations can take some time and patience is often a virtue. If a trader will give the pattern time to develop and look for the proper clues & then follow the guidelines, this chart pattern can be well-worth the effort to identify & trade.
Options for Trading the Triple Bottom as a bullish reversal pattern:
There are 4 methods of trading this pattern & it depends on your trading style.
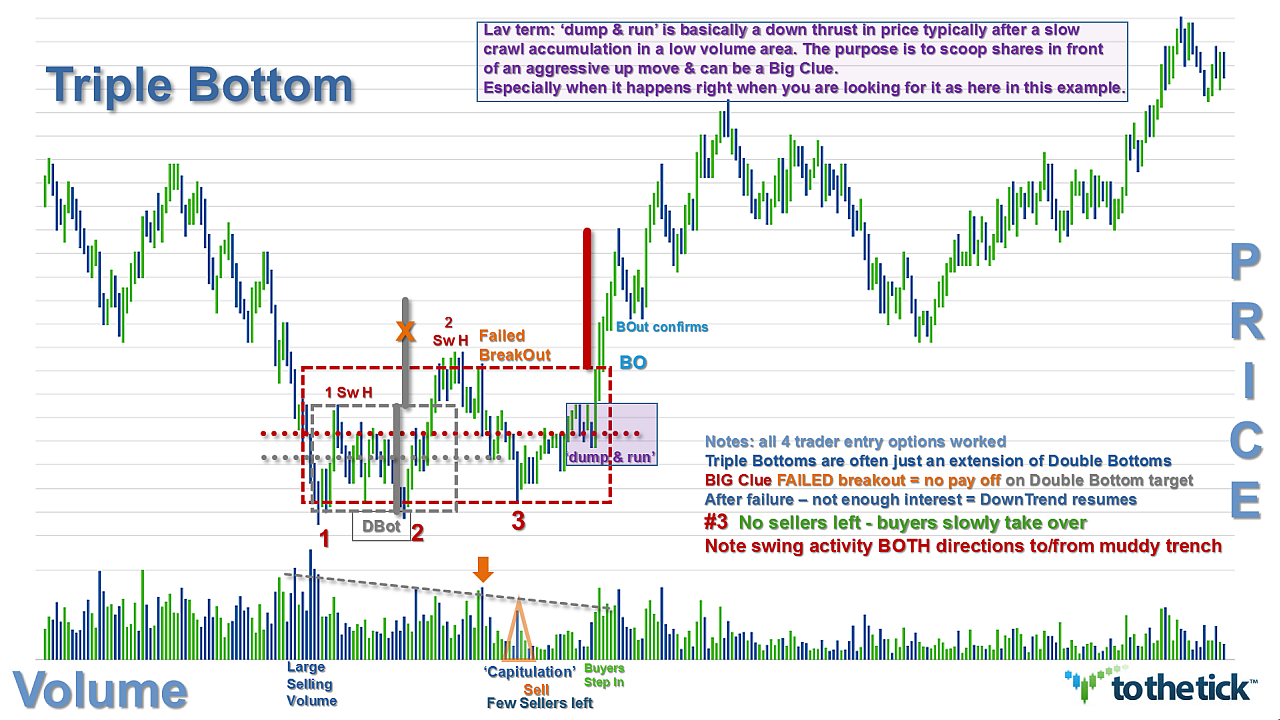
Most Aggressive traders will be looking for the 3rd trough in price as soon as the first 2 troughs show buyer support & the swing highs are in place. As the action comes back to re-test this low support area aggressive traders will be diligently monitoring the volume action looking for clues to the buying pressure. Entries in this area can work with a stop placement just below the lowest low of the formation. Aggressive traders should be prepared for capitulation selling or ‘dump & run’ type price action.
Aggressive traders may wait until a 3rd swing low is made & then monitor the action thru the middle of the reverse pattern. The concept of this option is to identify the reversal price action as being contained in a support/resistance ‘box’. Traders monitor the middle ‘muddy trench’ or roughly 50-50 of the spread in price offered by the pattern for an entry once the bulls control. Stop placement can be fairly tight just below the trench zone. An additional option to add to this set up is to include waiting for 3 solid efforts on resistance & then consider the muddy trench zone entry. This can be an accurate trade offering an entry looking to capitalize on a breakout & potentially a new bullish trend but without the risk of the most aggressive option.
Classic traders will look for a long entry with the breakout of the neckline or immediate pattern resistance. Stop placement right below the neckline price.
Conservative traders will watch the breakout & look for a re-test of that new breakout support price to hold for full confirmation of the Triple Bottom Reversal Pattern. Stop placement right below breakout price. Note that this method of waiting for this pullback may or may not offer an opportunity but statistically it has a high % of success when it does present.
The aggressive trading methods can highly increase the profit potential of any Triple Bottom & may offer more than one entry. However, the trader needs to assess whether the ‘extra’ profits choosing an earlier entry offers a decent risk:reward over waiting for some confirmation of action based on clearing a defined price resistance. Traders choosing these options should look for strength from buyers in combination with the lack of sellers. It cannot be stressed enough that volume is a major key & an expansion of bullish volume aids confirmation.
False breakouts do happen & confirmation needed is always a traders’ choice. Several methods that apply here for either intrabar &/or close bar options offered in sequence: breakout above resistance price, retrace holds new support line, price clears breakout swing high price, price clears next swing high of background downtrend price action, larger chart combination.
Stop placement considerations for all trade entry choices can be aggressively raised after the breakout of the price.
Since the Triple Bottom Reversal Pattern once confirmed has such a high degree of success indicating a change of trend, there are additional target considerations based on the knowledge that history repeats. All traders can look for tests on each of the swing highs seen in the immediate background downtrend price action. At any point & for all of these options, traders should gauge the continued conviction of the bulls based on momentum. If momentum is strong stick with the trade, if they get ‘lazy’ then consider taking profits & possibly look for a re-entry.
Examples: Triple Bottom Reversal Pattern
Follow Us